
ChinaNet Online Holdings, Inc. (CNET): Price and Financial Metrics
CNET Price/Volume Stats
| Current price | $1.23 | 52-week high | $4.53 |
| Prev. close | $1.45 | 52-week low | $0.96 |
| Day low | $0.96 | Volume | 92,200 |
| Day high | $1.45 | Avg. volume | 122,392 |
| 50-day MA | $1.45 | Dividend yield | N/A |
| 200-day MA | $0.00 | Market Cap | 2.83M |
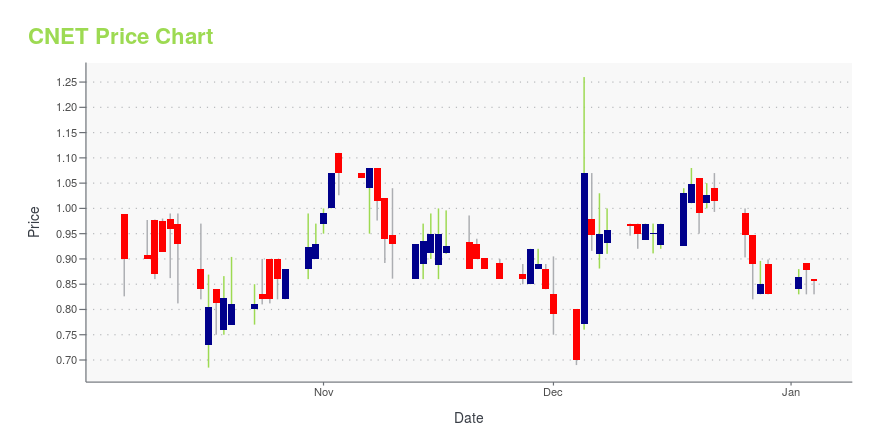
CNET Stock Price Chart Interactive Chart >
CNET Price Returns
| 1-mo | -15.94% |
| 3-mo | -23.13% |
| 6-mo | -27.65% |
| 1-year | -60.06% |
| 3-year | -89.72% |
| 5-year | -95.44% |
| YTD | -31.67% |
| 2024 | -45.78% |
| 2023 | -63.91% |
| 2022 | -54.00% |
| 2021 | -25.93% |
| 2020 | 15.88% |
Continue Researching CNET
Want to do more research on ChinaNet Online Holdings Inc's stock and its price? Try the links below:ChinaNet Online Holdings Inc (CNET) Stock Price | Nasdaq
ChinaNet Online Holdings Inc (CNET) Stock Quote, History and News - Yahoo Finance
ChinaNet Online Holdings Inc (CNET) Stock Price and Basic Information | MarketWatch
Loading social stream, please wait...