
ChinaNet Online Holdings, Inc. (CNET): Price and Financial Metrics
CNET Price/Volume Stats
| Current price | $0.79 | 52-week high | $1.42 |
| Prev. close | $0.80 | 52-week low | $0.65 |
| Day low | $0.75 | Volume | 1,800 |
| Day high | $0.79 | Avg. volume | 20,740 |
| 50-day MA | $0.80 | Dividend yield | N/A |
| 200-day MA | $0.89 | Market Cap | 5.69M |
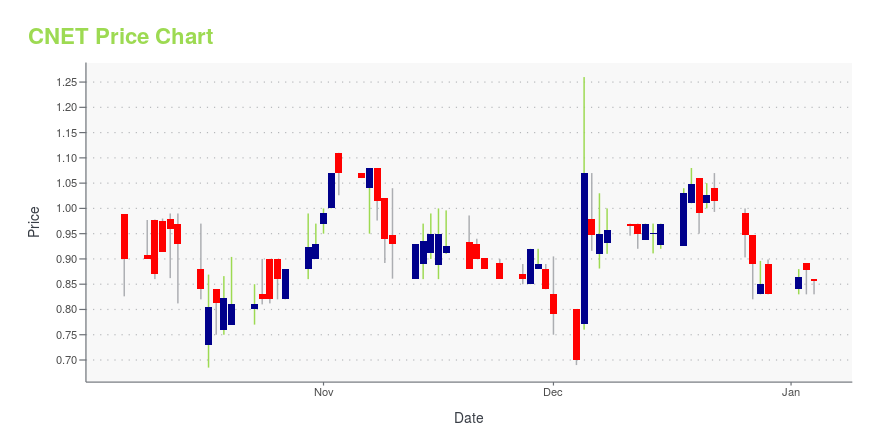
CNET Stock Price Chart Interactive Chart >
Latest CNET News From Around the Web
Below are the latest news stories about ZW DATA ACTION TECHNOLOGIES INC that investors may wish to consider to help them evaluate CNET as an investment opportunity.
ZW Data Action Technologies Announces Strategic Partnership with Digital Life to Develop Franchise AI ModelBEIJING, Dec. 05, 2023 (GLOBE NEWSWIRE) -- ZW Data Action Technologies Inc. (Nasdaq: CNET) (the "Company"), an integrated online advertising, precision marketing, data analytics and other value-added services provider serving enterprise clients, today announced its strategic partnership with Digital Life (Guangdong Hengqin) Technology Co., Ltd. ("Digital Life"), pursuant to which the parities will work together on developing a specialized AI model tailored for the franchise industry. The goal is |
ZW Data Action Technologies Reports Third Quarter and First Nine Months 2023 Unaudited Financial ResultsBEIJING, Nov. 20, 2023 (GLOBE NEWSWIRE) -- ZW Data Action Technologies Inc. (Nasdaq: CNET) (the "Company"), an integrated online advertising, precision marketing, data analytics and other value-added services provider serving enterprise clients, today announced its unaudited financial results for the three and nine months ended September 30, 2023. Third Quarter 2023 Financial Results Revenues For the third quarter of 2023, revenues increased by approximately $1.97 million, or 27.2%, to $9.18 mil |
ZW Data Action Technologies Reports Second Quarter and First Half 2023 Unaudited Financial ResultsBEIJING, Aug. 21, 2023 (GLOBE NEWSWIRE) -- ZW Data Action Technologies Inc. (Nasdaq: CNET) (the "Company"), an integrated online advertising, precision marketing, data analytics and other value-added services provider serving enterprise clients, today announced its unaudited financial results for the three and six months ended June 30, 2023. Second Quarter 2023 Financial Results Revenues For the second quarter of 2023, revenues increased by approximately $2.88 million, or 41.4%, to $9.82 million |
ZW Data Action Technologies Reports First Quarter 2023 Unaudited Financial ResultsBEIJING, May 22, 2023 (GLOBE NEWSWIRE) -- ZW Data Action Technologies Inc. (Nasdaq: CNET) (the "Company"), an integrated online advertising, precision marketing, data analytics and other value-added services provider serving enterprise clients, today announced its unaudited financial results for the three months ended March 31, 2023. First Quarter 2023 Financial Results Revenues For the first quarter of 2023, revenues decreased by approximately $1.34 million, or 17.5%, to $6.32 million from $7.6 |
ZW Data Action Technologies Reports Full Year 2022 Audited Financial ResultsBEIJING, April 17, 2023 (GLOBE NEWSWIRE) -- ZW Data Action Technologies Inc. (Nasdaq: CNET) (the "Company"), an integrated online advertising, precision marketing, data analytics and other value-added services provider serving enterprise clients, today announced its audited financial results for the year ended December 31, 2022. Full Year 2022 Financial Results Revenues For the full year of 2022, revenues decreased by $21.09 million, or 44.6%, to $26.24 million from $47.33 million for the last y |
CNET Price Returns
| 1-mo | 5.33% |
| 3-mo | -20.37% |
| 6-mo | -23.35% |
| 1-year | -44.37% |
| 3-year | -89.81% |
| 5-year | -88.53% |
| YTD | -4.82% |
| 2023 | -63.91% |
| 2022 | -54.00% |
| 2021 | -25.93% |
| 2020 | 15.88% |
| 2019 | -13.06% |
Continue Researching CNET
Want to do more research on ChinaNet Online Holdings Inc's stock and its price? Try the links below:ChinaNet Online Holdings Inc (CNET) Stock Price | Nasdaq
ChinaNet Online Holdings Inc (CNET) Stock Quote, History and News - Yahoo Finance
ChinaNet Online Holdings Inc (CNET) Stock Price and Basic Information | MarketWatch
Loading social stream, please wait...