
Cannae Holdings, Inc. (CNNE): Price and Financial Metrics
CNNE Price/Volume Stats
| Current price | $20.15 | 52-week high | $22.99 |
| Prev. close | $19.80 | 52-week low | $15.93 |
| Day low | $19.90 | Volume | 293,087 |
| Day high | $20.19 | Avg. volume | 626,704 |
| 50-day MA | $18.62 | Dividend yield | 2.43% |
| 200-day MA | $19.54 | Market Cap | 1.26B |
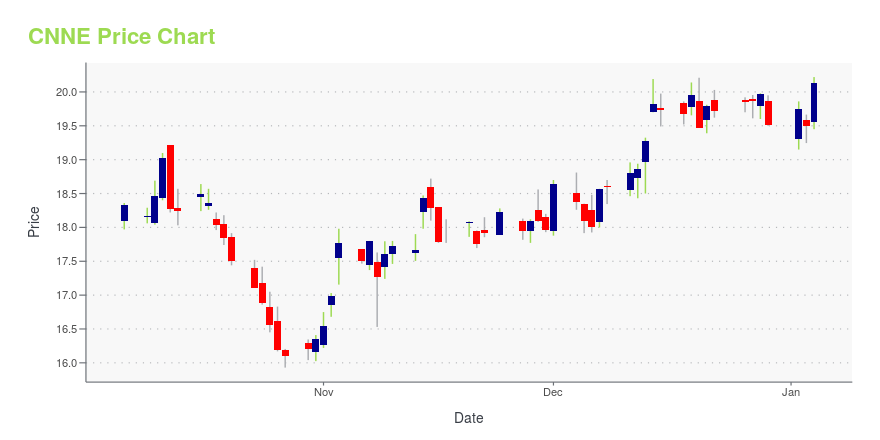
CNNE Stock Price Chart Interactive Chart >
Cannae Holdings, Inc. (CNNE) Company Bio
Cannae Holdings, Inc. is a diversified holding company. The Company has investments in a variety of industries including Restaurants, Technology Enabled Healthcare Services, Financial Services and more. The Company holds majority and minority equity investment stakes in a number of entities, including Ceridian Holdings, LLC, American Blue Ribbon Holdings, and LLC and T-System Holding LLC.
Latest CNNE News From Around the Web
Below are the latest news stories about CANNAE HOLDINGS INC that investors may wish to consider to help them evaluate CNNE as an investment opportunity.
Investors in Cannae Holdings (NYSE:CNNE) have unfortunately lost 55% over the last three yearsIf you love investing in stocks you're bound to buy some losers. But long term Cannae Holdings, Inc. ( NYSE:CNNE... |
Cannae Holdings, Inc. (NYSE:CNNE) Q3 2023 Earnings Call TranscriptCannae Holdings, Inc. (NYSE:CNNE) Q3 2023 Earnings Call Transcript November 7, 2023 Cannae Holdings, Inc. misses on earnings expectations. Reported EPS is $-2.18 EPS, expectations were $-0.3. Operator: Good afternoon, ladies and gentlemen, and welcome to the Cannae Holdings Inc. Third Quarter 2023 Financial Results Conference Call. [Operator Instructions]. As a reminder, this conference call […] |
Q3 2023 Cannae Holdings Inc Earnings CallQ3 2023 Cannae Holdings Inc Earnings Call |
Cannae Holdings, Inc. Announces Third Quarter 2023 Financial ResultsLAS VEGAS, November 07, 2023--Cannae Holdings, Inc. (NYSE: CNNE) ("Cannae" or the "Company") has released its third quarter 2023 financial results by posting them to its website. Please visit the Cannae website at www.cannaeholdings.com to view the third quarter 2023 financial results, which are included in its Letter to Shareholders. |
Cannae Holdings, Inc. Announces Third Quarter 2023 Earnings Release Date and Conference CallLAS VEGAS, October 24, 2023--Cannae Holdings, Inc. (NYSE: CNNE) ("Cannae" or the "Company") today announced that the Company will release its third quarter 2023 financial results after the market close on Tuesday, November 7, 2023. The Company will also hold a conference call to discuss its financial results at 5:00 pm (Eastern Time) on the same day. |
CNNE Price Returns
| 1-mo | 12.57% |
| 3-mo | 1.49% |
| 6-mo | -1.03% |
| 1-year | 2.05% |
| 3-year | -37.52% |
| 5-year | -27.10% |
| YTD | 3.99% |
| 2023 | -5.52% |
| 2022 | -41.25% |
| 2021 | -20.60% |
| 2020 | 19.04% |
| 2019 | 117.23% |
CNNE Dividends
| Ex-Dividend Date | Type | Payout Amount | Change | ||||||
|---|---|---|---|---|---|---|---|---|---|
| Loading, please wait... | |||||||||
Continue Researching CNNE
Want to do more research on Cannae Holdings Inc's stock and its price? Try the links below:Cannae Holdings Inc (CNNE) Stock Price | Nasdaq
Cannae Holdings Inc (CNNE) Stock Quote, History and News - Yahoo Finance
Cannae Holdings Inc (CNNE) Stock Price and Basic Information | MarketWatch
Loading social stream, please wait...