
Concentrix Corp. (CNXC): Price and Financial Metrics
CNXC Price/Volume Stats
| Current price | $67.43 | 52-week high | $106.10 |
| Prev. close | $66.79 | 52-week low | $53.89 |
| Day low | $67.21 | Volume | 211,200 |
| Day high | $68.30 | Avg. volume | 502,808 |
| 50-day MA | $63.66 | Dividend yield | 1.84% |
| 200-day MA | $75.10 | Market Cap | 4.41B |
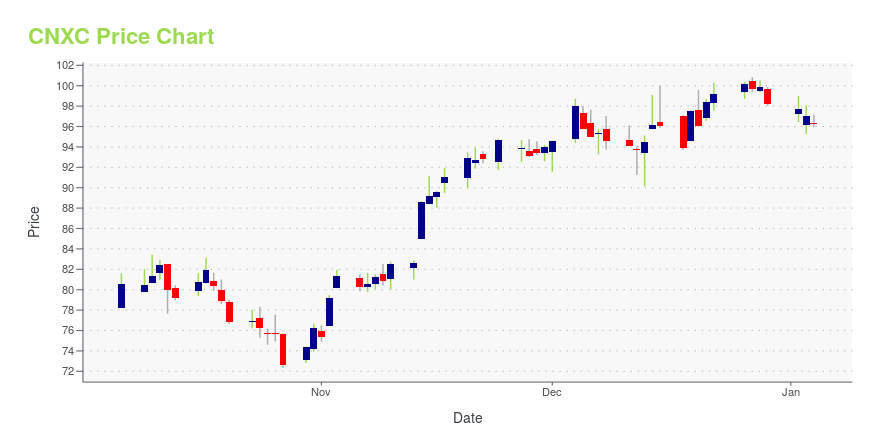
CNXC Stock Price Chart Interactive Chart >
Concentrix Corp. (CNXC) Company Bio
Concentrix Corp. engages in the provision of customer experience (CX)solutions and technology. It offers end-to-end capabilities, including CX process optimization, technology innovation, front- and back-office automation, analytics, and business transformation services to clients in five primary industry verticals. It delivers its services across all channels of communication, such as voice, chat, email, social media, asynchronous messaging, and custom applications. The company was founded in 1973 and is headquartered in Fremont, CA.
Latest CNXC News From Around the Web
Below are the latest news stories about CONCENTRIX CORP that investors may wish to consider to help them evaluate CNXC as an investment opportunity.
7 Compelling Tech Stocks to Snag From the Discount BinYou don’t need to be a Wall Street expert to realize that innovators dominated the equities space in 2023. |
7 Under-the-Radar Stocks Gearing Up for a 2025 BreakthroughIn a market where giants often grab the spotlight, a cadre of quietly thriving companies has been making significant strategic strides. |
How Good Is Concentrix Corporation (NASDAQ:CNXC), When It Comes To ROE?Many investors are still learning about the various metrics that can be useful when analysing a stock. This article is... |
Future Millionaire: 3 Undiscovered Stocks to 10X in the Next DecadeThe relentless pursuit of untapped potential in the stock market often leads investors on a quest to uncover hidden gems. |
Tech Titans Rising: 7 Underrated Stocks Set for Explosive GrowthWhile Wall Street keeps a watchful eye on the giants, there are lesser-known stocks quietly charting a course for explosive growth. |
CNXC Price Returns
| 1-mo | 7.91% |
| 3-mo | 23.14% |
| 6-mo | -25.89% |
| 1-year | -17.82% |
| 3-year | -57.08% |
| 5-year | N/A |
| YTD | -30.42% |
| 2023 | -25.36% |
| 2022 | -24.91% |
| 2021 | 81.22% |
| 2020 | N/A |
| 2019 | N/A |
CNXC Dividends
| Ex-Dividend Date | Type | Payout Amount | Change | ||||||
|---|---|---|---|---|---|---|---|---|---|
| Loading, please wait... | |||||||||
Loading social stream, please wait...