
PC Connection, Inc. (CNXN): Price and Financial Metrics
CNXN Price/Volume Stats
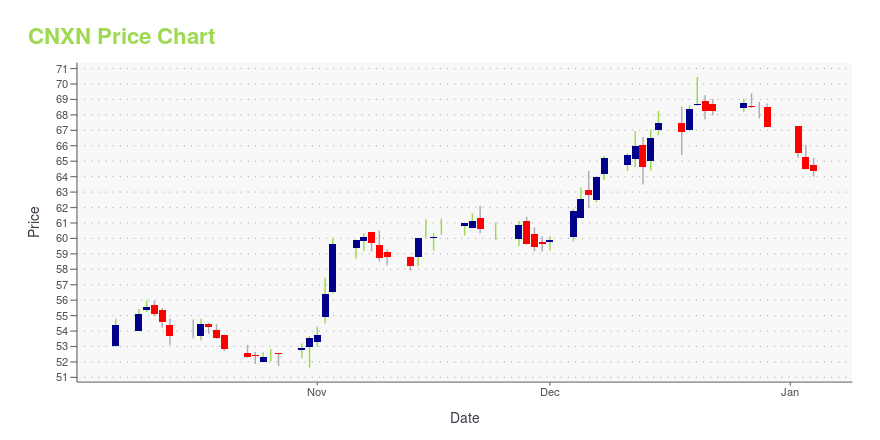
| Current price | $68.80 | 52-week high | $70.55 |
| Prev. close | $67.35 | 52-week low | $47.42 |
| Day low | $67.81 | Volume | 61,600 |
| Day high | $68.89 | Avg. volume | 74,536 |
| 50-day MA | $65.71 | Dividend yield | 0.59% |
| 200-day MA | $63.74 | Market Cap | 1.81B |
CNXN Stock Price Chart Interactive Chart >
PC Connection, Inc. (CNXN) Company Bio
Connection offers IT products, such as computer systems, software and peripheral equipment, networking communications, and other products and accessories. The company was founded in 1982 and is based in Merrimack, New Hampshire.
Latest CNXN News From Around the Web
Below are the latest news stories about PC CONNECTION INC that investors may wish to consider to help them evaluate CNXN as an investment opportunity.
Insider Sell: Sr. VP, CFO & Treasurer Thomas Baker Sells 5,000 Shares of PC Connection Inc ...In a notable insider transaction, Thomas Baker, the Senior Vice President, Chief Financial Officer, and Treasurer of PC Connection Inc (NASDAQ:CNXN), sold 5,000 shares of the company on December 13, 2023. |
Connection Launches Helix Center for Applied AI and RoboticsMERRIMACK, N.H., December 14, 2023--Connection (PC Connection, Inc.; NASDAQ: CNXN), a leading information technology solutions provider to business, government, healthcare, and education markets, is pleased to announce the company has launched the Helix Center for Applied AI and Robotics. Helix brings together industry-leading experts, resources, and support designed to help organizations of all sizes realize the benefits of artificial intelligence and automation. |
Connection Achieves Microsoft Azure Expert MSP RenewalMERRIMACK, N.H., December 13, 2023--Connection (PC Connection, Inc.; NASDAQ: CNXN), a leading information technology solutions provider to business, government, healthcare, and education markets, is pleased to announce the company has secured a renewal of its Microsoft Azure Expert Managed Service Provider (MSP) status. The Azure Expert MSP recognition is awarded to Microsoft partners who complete an intensive auditing process, demonstrate robust technical capabilities, and offer proactive and r |
Insider Sell Alert: Director Negrini Beffa Sells 5,000 Shares of PC Connection Inc (CNXN)In a recent transaction on December 4, 2023, Director Negrini Beffa sold 5,000 shares of PC Connection Inc (NASDAQ:CNXN), a leading provider of a wide range of information technology solutions. |
Insider Sell: President & CEO Timothy McGrath Sells 22,694 Shares of PC Connection Inc (CNXN)In a notable insider transaction, Timothy McGrath, the President & CEO of PC Connection Inc (NASDAQ:CNXN), sold 22,694 shares of the company on November 21, 2023. |
CNXN Price Returns
| 1-mo | 6.87% |
| 3-mo | 8.19% |
| 6-mo | 4.72% |
| 1-year | 45.09% |
| 3-year | 53.48% |
| 5-year | 107.67% |
| YTD | 2.67% |
| 2023 | 44.26% |
| 2022 | 8.74% |
| 2021 | -8.80% |
| 2020 | -4.77% |
| 2019 | 67.04% |
CNXN Dividends
| Ex-Dividend Date | Type | Payout Amount | Change | ||||||
|---|---|---|---|---|---|---|---|---|---|
| Loading, please wait... | |||||||||
Continue Researching CNXN
Here are a few links from around the web to help you further your research on Pc Connection Inc's stock as an investment opportunity:Pc Connection Inc (CNXN) Stock Price | Nasdaq
Pc Connection Inc (CNXN) Stock Quote, History and News - Yahoo Finance
Pc Connection Inc (CNXN) Stock Price and Basic Information | MarketWatch
Loading social stream, please wait...