Cohu, Inc. (COHU): Price and Financial Metrics
COHU Price/Volume Stats
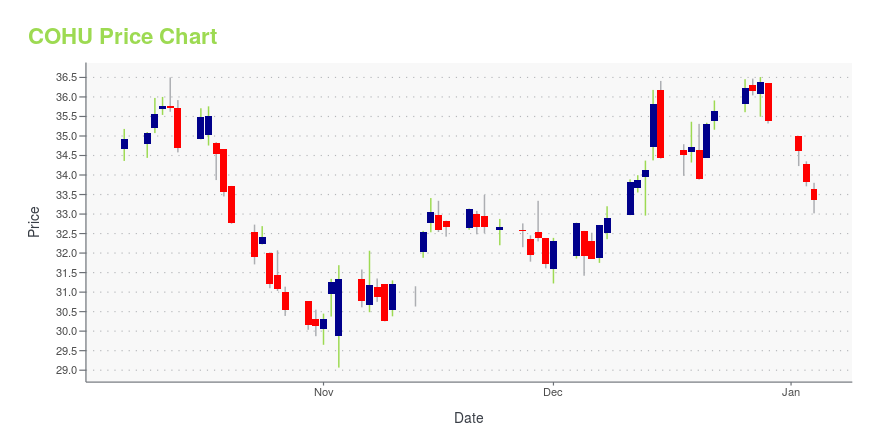
Current price | $37.65 | 52-week high | $39.73 |
Prev. close | $38.49 | 52-week low | $24.06 |
Day low | $37.18 | Volume | 57,917 |
Day high | $38.27 | Avg. volume | 212,041 |
50-day MA | $35.86 | Dividend yield | N/A |
200-day MA | $33.52 | Market Cap | 1.78B |
COHU Stock Price Chart Interactive Chart >
COHU POWR Grades
- Momentum is the dimension where COHU ranks best; there it ranks ahead of 99.2% of US stocks.
- The strongest trend for COHU is in Stability, which has been heading up over the past 179 days.
- COHU's current lowest rank is in the Growth metric (where it is better than 7.94% of US stocks).
COHU Stock Summary
- COHU INC's stock had its IPO on November 12, 1986, making it an older stock than 92.98% of US equities in our set.
- With a year-over-year growth in debt of -52.22%, COHU INC's debt growth rate surpasses just 5.61% of about US stocks.
- As for revenue growth, note that COHU's revenue has grown -7.57% over the past 12 months; that beats the revenue growth of only 19.22% of US companies in our set.
- Stocks that are quantitatively similar to COHU, based on their financial statements, market capitalization, and price volatility, are MDRX, ONTO, TRVN, AYRO, and XOS.
- Visit COHU's SEC page to see the company's official filings. To visit the company's web site, go to www.cohu.com.
COHU Valuation Summary
- In comparison to the median Technology stock, COHU's EV/EBIT ratio is 38.06% lower, now standing at 13.1.
- Over the past 243 months, COHU's price/sales ratio has gone down 0.7.
Below are key valuation metrics over time for COHU.
Stock | Date | P/S | P/B | P/E | EV/EBIT |
---|---|---|---|---|---|
COHU | 2023-05-22 | 2.2 | 1.9 | 19.6 | 13.1 |
COHU | 2023-05-19 | 2.2 | 1.9 | 19.4 | 12.9 |
COHU | 2023-05-18 | 2.2 | 1.9 | 19.6 | 13.1 |
COHU | 2023-05-17 | 2.2 | 1.9 | 19.2 | 12.8 |
COHU | 2023-05-16 | 2.1 | 1.8 | 18.5 | 12.3 |
COHU | 2023-05-15 | 2.1 | 1.8 | 18.3 | 12.1 |
COHU Growth Metrics
- Its 4 year cash and equivalents growth rate is now at 104.54%.
- Its 5 year net income to common stockholders growth rate is now at -649.24%.
- Its 3 year cash and equivalents growth rate is now at 67.42%.

The table below shows COHU's growth in key financial areas (numbers in millions of US dollars).
Date | Revenue | Operating Cash Flow | Net Income to Common Stock |
---|---|---|---|
2022-12-31 | 812.775 | 112.861 | 96.847 |
2022-09-30 | 813.53 | 113.063 | 96.108 |
2022-06-30 | 831.906 | 107.907 | 94.959 |
2022-03-31 | 859.483 | 93.577 | 161.287 |
2021-12-31 | 887.214 | 97.729 | 167.325 |
2021-09-30 | 897.709 | 91.675 | 161.297 |
COHU's Quality Factors
The “Quality” component of the POWR Ratings focuses on 31 different factors of a companies fundamentals and operational strength. Here are some key insights as we drill into the specifics of these quality attributes.- COHU has a Quality Grade of C, ranking ahead of 56.46% of graded US stocks.
- COHU's asset turnover comes in at 0.719 -- ranking 29th of 75 Measuring and Control Equipment stocks.
- DAIO, CLIR, and MKSI are the stocks whose asset turnover ratios are most correlated with COHU.
The table below shows COHU's key quality metrics over time.
Period | Asset Turnover | Gross Margin | ROIC |
---|---|---|---|
2021-09-25 | 0.719 | 0.439 | 0.341 |
2021-06-26 | 0.691 | 0.439 | 0.270 |
2021-03-27 | 0.648 | 0.440 | 0.075 |
2020-12-26 | 0.595 | 0.427 | 0.001 |
2020-09-26 | 0.540 | 0.408 | -0.053 |
2020-06-27 | 0.530 | 0.405 | -0.055 |
COHU Price Target
For more insight on analysts targets of COHU, see our COHU price target page. And for a list of of all stocks sorted by upside potential based on analyst target price, see our Top Price Target page.
Average Price Target | $48.44 | Average Broker Recommendation | 1.61 (Moderate Buy) |
Cohu, Inc. (COHU) Company Bio
Cohu Inc. is a supplier of semiconductor test and inspection handlers, micro-electro mechanical system test modules, test contactors and thermal subsystems used by global semiconductor manufacturers and test subcontractors. The company was founded in 1947 and is based in Poway, California.
Latest COHU News From Around the Web
Below are the latest news stories about COHU INC that investors may wish to consider to help them evaluate COHU as an investment opportunity.
Should You Investigate Cohu, Inc. (NASDAQ:COHU) At US$34.26?Cohu, Inc. ( NASDAQ:COHU ), is not the largest company out there, but it received a lot of attention from a substantial... |
Cohu to Present at Upcoming Investor ConferencesPOWAY, Calif., May 11, 2023--Cohu, Inc. (NASDAQ: COHU), a global supplier of equipment and services optimizing semiconductor manufacturing yield and productivity, today announced that management will participate at the following investor conferences: |
1 Super Semiconductor Stock to Buy Before Its Next Growth PhaseThe semiconductor industry on the whole is having a tough year in 2023. High inflation and rising interest rates forced consumers to cut back on spending and some big-ticket electronics are getting slashed from household budgets. Cohu (NASDAQ: COHU) is one of them. |
Cohu, Inc. (COHU) Q1 2023 Earnings Call TranscriptCohu, Inc. (COHU) Q1 2023 Results Conference Call May 04, 2023 04:30 PM ET Company Participants Jeff Jones - CFO Luis Muller - President and CEO Conference Call Participants Craig Ellis - B. Riley Securities David Duley - Steelhead Securities Tyler Burmeister - Craig-Hallum Bob Mertens - Cowen Brian Chin - Stifel Presentation Operator Good day, and thank you for standing by. Welcome to today's Conference Call to discuss Cohu's First Quarter Financial Results and Second Quarter Outlook. At this time, all participants are in a listen only mode. After the speakers’ presentation, there will be a question-and-answer session [Operator Instr... |
Cohu (COHU) Q1 Earnings Top EstimatesCohu (COHU) delivered earnings and revenue surprises of 3.70% and 0.74%, respectively, for the quarter ended March 2023. Do the numbers hold clues to what lies ahead for the stock? |
COHU Price Returns
1-mo | 9.26% |
3-mo | 4.90% |
6-mo | 8.31% |
1-year | 26.26% |
3-year | 113.31% |
5-year | 48.96% |
YTD | 17.47% |
2022 | -15.86% |
2021 | -0.24% |
2020 | 67.55% |
2019 | 44.29% |
2018 | -25.96% |
Continue Researching COHU
Want to do more research on Cohu Inc's stock and its price? Try the links below:Cohu Inc (COHU) Stock Price | Nasdaq
Cohu Inc (COHU) Stock Quote, History and News - Yahoo Finance
Cohu Inc (COHU) Stock Price and Basic Information | MarketWatch
Loading social stream, please wait...