
Coinbase Global Inc. (COIN): Price and Financial Metrics
COIN Price/Volume Stats
| Current price | $242.93 | 52-week high | $283.48 |
| Prev. close | $231.52 | 52-week low | $69.63 |
| Day low | $237.56 | Volume | 7,906,705 |
| Day high | $249.16 | Avg. volume | 11,376,093 |
| 50-day MA | $233.86 | Dividend yield | N/A |
| 200-day MA | $181.90 | Market Cap | 59.66B |
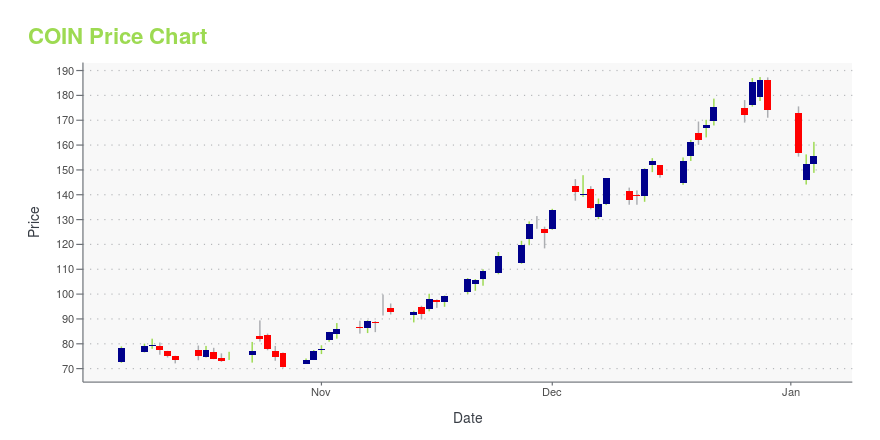
COIN Stock Price Chart Interactive Chart >
Coinbase Global Inc. (COIN) Company Bio
Coinbase Global, Inc. provides financial infrastructure and technology for the cryptoeconomy. The company provides primary financial account for the cryptoeconomy, a platform to invest, store, spend, earn, and use crypto assets; an online marketplace for hedge funds, money managers, and corporations; and a platform with technology and services to developers, merchants, and asset issuers that enables them to build applications that leverage crypto protocols. It serves retail users, institutions, and ecosystem partners. The company was founded in 2012 and is based in San Francisco, California.
Latest COIN News From Around the Web
Below are the latest news stories about COINBASE GLOBAL INC that investors may wish to consider to help them evaluate COIN as an investment opportunity.
2023's Biggest Winners In The Russell 1,000There was a somewhat elevated share of the S&P 500 experiencing gains of over 100%. Expanding to the Russell 1,000, there were 34 stocks with total returns of more than 100%. |
7 Cutting-Edge Tech Stocks That Will Define 2024After the massive gains artificial intelligence companies saw in 2023, there are additional gains to realize by investing in AI in 2024. |
The 3 Best Crypto Stocks to Buy for the 2024 RallyCrypto stocks should be on every investor's watch list. |
Cathie Wood Stocks To Buy And Watch: COIN Stock Hits New HighAmong the best Cathie Wood stocks to buy and watch in today's stock market are Coinbase, Roku, Tesla stock and Zoom Video. |
5 Leveraged ETFs That Gained More Than 75% in Q4Wall Street enjoyed a robust fourth quarter despite experiencing a correction in late October. |
COIN Price Returns
| 1-mo | 13.21% |
| 3-mo | 2.80% |
| 6-mo | 94.03% |
| 1-year | 162.09% |
| 3-year | 3.34% |
| 5-year | N/A |
| YTD | 39.68% |
| 2023 | 391.44% |
| 2022 | -85.98% |
| 2021 | N/A |
| 2020 | N/A |
| 2019 | N/A |
Loading social stream, please wait...