Collegium Pharmaceutical, Inc. (COLL): Price and Financial Metrics
COLL Price/Volume Stats
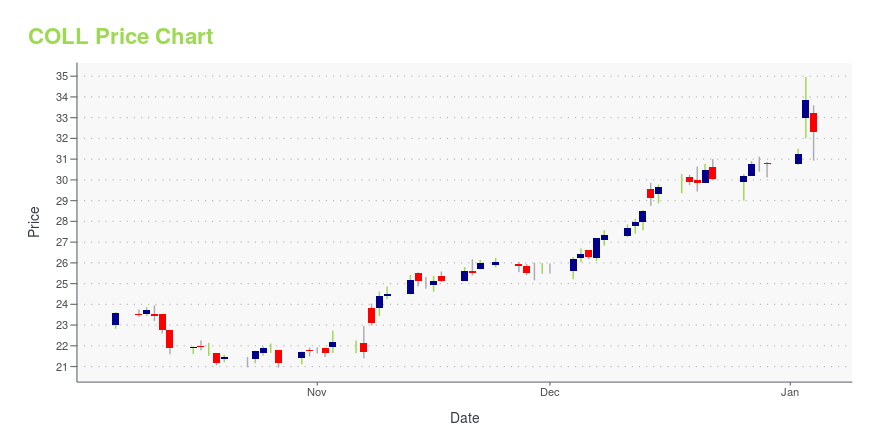
Current price | $22.02 | 52-week high | $30.22 |
Prev. close | $22.08 | 52-week low | $15.58 |
Day low | $22.00 | Volume | 53,314 |
Day high | $22.61 | Avg. volume | 376,142 |
50-day MA | $23.10 | Dividend yield | N/A |
200-day MA | $23.92 | Market Cap | 764.84M |
COLL Stock Price Chart Interactive Chart >
COLL POWR Grades
- COLL scores best on the Quality dimension, with a Quality rank ahead of 94.57% of US stocks.
- COLL's strongest trending metric is Growth; it's been moving down over the last 177 days.
- COLL ranks lowest in Momentum; there it ranks in the 9th percentile.
COLL Stock Summary
- The price/operating cash flow metric for COLLEGIUM PHARMACEUTICAL INC is higher than only 12.68% of stocks in our set with a positive cash flow.
- Over the past twelve months, COLL has reported earnings growth of -507.1%, putting it ahead of just 2.92% of US stocks in our set.
- Revenue growth over the past 12 months for COLLEGIUM PHARMACEUTICAL INC comes in at 71.27%, a number that bests 92.47% of the US stocks we're tracking.
- Stocks that are quantitatively similar to COLL, based on their financial statements, market capitalization, and price volatility, are XPOF, GHL, USIO, AMG, and PIPR.
- Visit COLL's SEC page to see the company's official filings. To visit the company's web site, go to www.collegiumpharma.com.
COLL Valuation Summary
- In comparison to the median Healthcare stock, COLL's price/sales ratio is 26.32% lower, now standing at 1.4.
- COLL's price/sales ratio has moved NA NA over the prior 102 months.
Below are key valuation metrics over time for COLL.
Stock | Date | P/S | P/B | P/E | EV/EBIT |
---|---|---|---|---|---|
COLL | 2023-09-22 | 1.4 | 3.9 | -69.3 | 16.3 |
COLL | 2023-09-21 | 1.5 | 3.9 | -70.2 | 16.4 |
COLL | 2023-09-20 | 1.5 | 3.9 | -70.9 | 16.5 |
COLL | 2023-09-19 | 1.5 | 3.9 | -70.2 | 16.4 |
COLL | 2023-09-18 | 1.4 | 3.9 | -69.6 | 16.3 |
COLL | 2023-09-15 | 1.5 | 3.9 | -70.5 | 16.5 |
COLL Growth Metrics
- Its 3 year net income to common stockholders growth rate is now at 241.79%.
- Its 4 year net income to common stockholders growth rate is now at 87.63%.
- The 3 year net cashflow from operations growth rate now stands at -56.03%.

The table below shows COLL's growth in key financial areas (numbers in millions of US dollars).
Date | Revenue | Operating Cash Flow | Net Income to Common Stock |
---|---|---|---|
2022-09-30 | 361.675 | 94.103 | -42.837 |
2022-06-30 | 313.505 | 68.588 | -35.248 |
2022-03-31 | 272.898 | 57.672 | 42.786 |
2021-12-31 | 276.868 | 103.557 | 71.517 |
2021-09-30 | 325.777 | 89.936 | 103.509 |
2021-06-30 | 326.11 | 106.862 | 106.749 |
COLL's Quality Factors
The “Quality” component of the POWR Ratings focuses on 31 different factors of a companies fundamentals and operational strength. Here are some key insights as we drill into the specifics of these quality attributes.- COLL has a Quality Grade of B, ranking ahead of 83.9% of graded US stocks.
- COLL's asset turnover comes in at 0.493 -- ranking 87th of 681 Pharmaceutical Products stocks.
- IBIO, IRWD, and COCP are the stocks whose asset turnover ratios are most correlated with COLL.
The table below shows COLL's key quality metrics over time.
Period | Asset Turnover | Gross Margin | ROIC |
---|---|---|---|
2021-06-30 | 0.493 | 0.608 | 0.369 |
2021-03-31 | 0.498 | 0.612 | 0.422 |
2020-12-31 | 0.483 | 0.580 | 0.341 |
2020-09-30 | 0.552 | 0.522 | 0.367 |
2020-06-30 | 0.638 | 0.460 | 0.266 |
2020-03-31 | 0.772 | 0.391 | 2.336 |
COLL Price Target
For more insight on analysts targets of COLL, see our COLL price target page. And for a list of of all stocks sorted by upside potential based on analyst target price, see our Top Price Target page.
Average Price Target | $26.71 | Average Broker Recommendation | 1.56 (Moderate Buy) |
Collegium Pharmaceutical, Inc. (COLL) Company Bio
Collegium Pharmaceuticals is a specialty pharmaceutical company focused on developing a portfolio of products that incorporate its patent-protected DETERx technology platform for the treatment of chronic pain and other diseases. The company was founded in 2002 and is based in Canton, Massachusetts.
Latest COLL News From Around the Web
Below are the latest news stories about COLLEGIUM PHARMACEUTICAL INC that investors may wish to consider to help them evaluate COLL as an investment opportunity.
Collegium Announces 10 Poster Presentations at PAINWeek Conference 2023STOUGHTON, Mass., Aug. 28, 2023 (GLOBE NEWSWIRE) -- Collegium Pharmaceutical, Inc. (Nasdaq: COLL), a leading, diversified specialty pharmaceutical company committed to improving the lives of people living with serious medical conditions, today announced that 10 poster presentations highlighting data regarding its diversified pain portfolio will be presented at PAINWeek Conference 2023, being held in Las Vegas, NV from September 5–8, 2023. “Collegium is dedicated to responsible pain management an |
Collegium Announces Extension of Nucynta Regulatory Exclusivity through July 2026STOUGHTON, Mass., Aug. 24, 2023 (GLOBE NEWSWIRE) -- Collegium Pharmaceutical, Inc. (Nasdaq: COLL), a leading, diversified specialty pharmaceutical company committed to improving the lives of people living with serious medical conditions, today announced that the U.S. Food and Drug Administration (FDA) has granted New Patient Population exclusivity for Nucynta®, an immediate release formulation of tapentadol. This grant extends the period of U.S. exclusivity for Nucynta from June 27, 2025 to July |
Collegium Announces $50 Million Accelerated Share Repurchase ProgramSTOUGHTON, Mass., Aug. 07, 2023 (GLOBE NEWSWIRE) -- Collegium Pharmaceutical, Inc. (Nasdaq: COLL), a leading, diversified specialty pharmaceutical company committed to improving the lives of people living with serious medical conditions, today announced that it has entered into an Accelerated Share Repurchase ("ASR") agreement with Jefferies LLC to repurchase $50 million of the Company’s common stock. Collegium will execute the ASR as part of the $100 million share repurchase program authorized |
Here's What Key Metrics Tell Us About Collegium Pharmaceutical (COLL) Q2 EarningsAlthough the revenue and EPS for Collegium Pharmaceutical (COLL) give a sense of how its business performed in the quarter ended June 2023, it might be worth considering how some key metrics compare with Wall Street estimates and the year-ago numbers. |
Collegium Pharmaceutical (COLL) Q2 Earnings Beat EstimatesCollegium Pharmaceutical (COLL) delivered earnings and revenue surprises of 3.28% and 1.76%, respectively, for the quarter ended June 2023. Do the numbers hold clues to what lies ahead for the stock? |
COLL Price Returns
1-mo | -6.26% |
3-mo | 1.06% |
6-mo | -8.21% |
1-year | 42.43% |
3-year | 19.09% |
5-year | 49.39% |
YTD | -5.09% |
2022 | 24.20% |
2021 | -6.74% |
2020 | -2.67% |
2019 | 19.86% |
2018 | -6.99% |
Continue Researching COLL
Here are a few links from around the web to help you further your research on Collegium Pharmaceutical Inc's stock as an investment opportunity:Collegium Pharmaceutical Inc (COLL) Stock Price | Nasdaq
Collegium Pharmaceutical Inc (COLL) Stock Quote, History and News - Yahoo Finance
Collegium Pharmaceutical Inc (COLL) Stock Price and Basic Information | MarketWatch
Loading social stream, please wait...