CommScope Holding Company, Inc. (COMM): Price and Financial Metrics
GET POWR RATINGS... FREE!
COMM POWR Grades
- Growth is the dimension where COMM ranks best; there it ranks ahead of 91.12% of US stocks.
- COMM's strongest trending metric is Sentiment; it's been moving up over the last 179 days.
- COMM's current lowest rank is in the Quality metric (where it is better than 12.85% of US stocks).
COMM Stock Summary
- The capital turnover (annual revenue relative to shareholder's equity) for COMM is -54.83 -- better than merely 0.45% of US stocks.
- COMM's price/sales ratio is 0.19; that's higher than the P/S ratio of merely 2.63% of US stocks.
- COMM's equity multiplier -- a measure of assets relative to shareholders'equity -- is greater than that of 99.98% of US stocks.
- If you're looking for stocks that are quantitatively similar to CommScope Holding Company Inc, a group of peers worth examining would be WYNN, BGI, IMH, DESP, and MKD.
- Visit COMM's SEC page to see the company's official filings. To visit the company's web site, go to www.commscope.com.
COMM Valuation Summary
- In comparison to the median Technology stock, COMM's price/earnings ratio is 120.26% lower, now standing at -7.9.
- COMM's price/earnings ratio has moved down 527.8 over the prior 96 months.
- COMM's price/sales ratio has moved down 0.4 over the prior 96 months.
Below are key valuation metrics over time for COMM.
Stock | Date | P/S | P/B | P/E | EV/EBIT |
---|---|---|---|---|---|
COMM | 2021-09-01 | 0.4 | 46.0 | -7.9 | 79.3 |
COMM | 2021-08-31 | 0.4 | 46.8 | -8.0 | 79.7 |
COMM | 2021-08-30 | 0.4 | 47.0 | -8.1 | 79.8 |
COMM | 2021-08-27 | 0.4 | 47.3 | -8.1 | 79.9 |
COMM | 2021-08-26 | 0.4 | 45.9 | -7.9 | 79.3 |
COMM | 2021-08-25 | 0.4 | 46.9 | -8.1 | 79.7 |
COMM Growth Metrics
- Its 3 year net income to common stockholders growth rate is now at 206.56%.
- Its 2 year revenue growth rate is now at 104.21%.
- The year over year price growth rate now stands at 56.17%.

The table below shows COMM's growth in key financial areas (numbers in millions of US dollars).
Date | Revenue | Operating Cash Flow | Net Income to Common Stock |
---|---|---|---|
2021-12-31 | 8,586.7 | 122.3 | -519.9 |
2021-09-30 | 8,494.4 | 232.4 | -408.9 |
2021-06-30 | 8,557.2 | 337.5 | -400.8 |
2021-03-31 | 8,474.7 | 354.9 | -567.7 |
2020-12-31 | 8,435.9 | 436.2 | -629.5 |
2020-09-30 | 8,602.8 | 674.5 | -1,089.6 |
COMM's Quality Factors
The “Quality” component of the POWR Ratings focuses on 31 different factors of a companies fundamentals and operational strength. Here are some key insights as we drill into the specifics of these quality attributes.- COMM has a Quality Grade of D, ranking ahead of 11.88% of graded US stocks.
- COMM's asset turnover comes in at 0.634 -- ranking 116th of 208 Electronic Equipment stocks.
- AVYA, AMD, and FORM are the stocks whose asset turnover ratios are most correlated with COMM.
The table below shows COMM's key quality metrics over time.
Period | Asset Turnover | Gross Margin | ROIC |
---|---|---|---|
2021-09-30 | 0.634 | 0.319 | 0.009 |
2021-06-30 | 0.633 | 0.327 | 0.013 |
2021-03-31 | 0.619 | 0.328 | -0.002 |
2020-12-31 | 0.610 | 0.326 | -0.007 |
2020-09-30 | 0.613 | 0.322 | -0.045 |
2020-06-30 | 0.612 | 0.300 | -0.052 |
COMM Price Target
For more insight on analysts targets of COMM, see our COMM price target page. And for a list of of all stocks sorted by upside potential based on analyst target price, see our Top Price Target page.
Average Price Target | $21.59 | Average Broker Recommendation | 1.79 (Moderate Buy) |
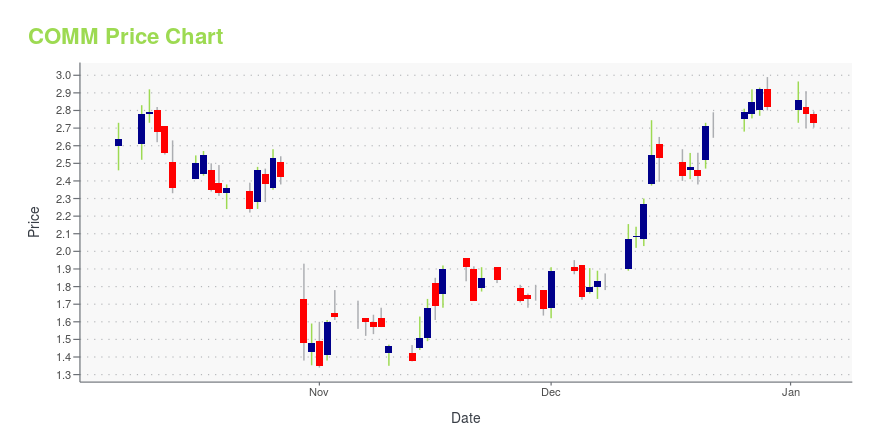
COMM Stock Price Chart Interactive Chart >
COMM Price/Volume Stats
Current price | $6.58 | 52-week high | $22.18 |
Prev. close | $6.81 | 52-week low | $5.94 |
Day low | $6.38 | Volume | 3,671,300 |
Day high | $6.72 | Avg. volume | 4,416,042 |
50-day MA | $7.11 | Dividend yield | N/A |
200-day MA | $10.34 | Market Cap | 1.36B |
CommScope Holding Company, Inc. (COMM) Company Bio
Commscope provides connectivity and infrastructure solutions for wireless, business enterprise, and residential broadband networks worldwide. The company operates through three segments: Wireless, Enterprise, and Broadband. The company was founded in 1976 and is based in Hickory, North Carolina.
Latest COMM News From Around the Web
Below are the latest news stories about CommScope Holding Company Inc that investors may wish to consider to help them evaluate COMM as an investment opportunity.
Perficient (PRFT) Q4 Earnings Beat Estimates, Revenues Up Y/YPerficient (PRFT) Q4 results reflect growth in revenues driven by accelerated demand and strong utilization of its capabilities. |
Cogent (CCOI) Q4 Earnings Beat Estimates on Top-Line GrowthTop-line expansion on the back of higher on-net revenues and accretive customer connections enable Cogent (CCOI) to beat fourth-quarter 2021 earnings estimates. |
6 Stock to Buy With the Potential of Earnings BeatYour search for tickers with the potential of positive earnings surprise ends here. |
Bandwidth (BAND) Q4 Earnings Beat on Healthy Revenue GrowthNew customer additions, robust cross-selling momentum, differentiated global platform and reinforced customer relationships help Bandwidth (BAND) to beat fourth-quarter 2021 earnings estimates. |
CommScope Holding Company, Inc. -- Moody's announces completion of a periodic review of ratings of CommScope Holding Company, Inc.Announcement of Periodic Review: Moody's announces completion of a periodic review of ratings of CommScope Holding Company, Inc.Global Credit Research - 22 Feb 2022New York, February 22, 2022 -- Moody's Investors Service ("Moody's") has completed a periodic review of the ratings of CommScope Holding Company, Inc. and other ratings that are associated with the same analytical unit. The review was conducted through a portfolio review discussion held on 14 February 2022 in which Moody's reassessed the appropriateness of the ratings in the context of the relevant principal methodology (ies), recent developments, and a comparison of the financial and operating profile to similarly rated peers. Since 1 January 2019, Moody's practice has been to issue a press release following each periodic ... |
COMM Price Returns
1-mo | -0.75% |
3-mo | -33.80% |
6-mo | -37.63% |
1-year | -65.07% |
3-year | -62.29% |
5-year | -82.18% |
YTD | -40.40% |
2021 | -17.61% |
2020 | -5.57% |
2019 | -13.42% |
2018 | -56.67% |
2017 | 1.69% |
Continue Researching COMM
Here are a few links from around the web to help you further your research on CommScope Holding Company Inc's stock as an investment opportunity:CommScope Holding Company Inc (COMM) Stock Price | Nasdaq
CommScope Holding Company Inc (COMM) Stock Quote, History and News - Yahoo Finance
CommScope Holding Company Inc (COMM) Stock Price and Basic Information | MarketWatch
Loading social stream, please wait...