
Compass Inc. Cl A (COMP): Price and Financial Metrics
COMP Price/Volume Stats
| Current price | $4.44 | 52-week high | $4.89 |
| Prev. close | $4.32 | 52-week low | $1.82 |
| Day low | $4.29 | Volume | 3,543,100 |
| Day high | $4.48 | Avg. volume | 4,381,021 |
| 50-day MA | $3.92 | Dividend yield | N/A |
| 200-day MA | $3.32 | Market Cap | 2.20B |
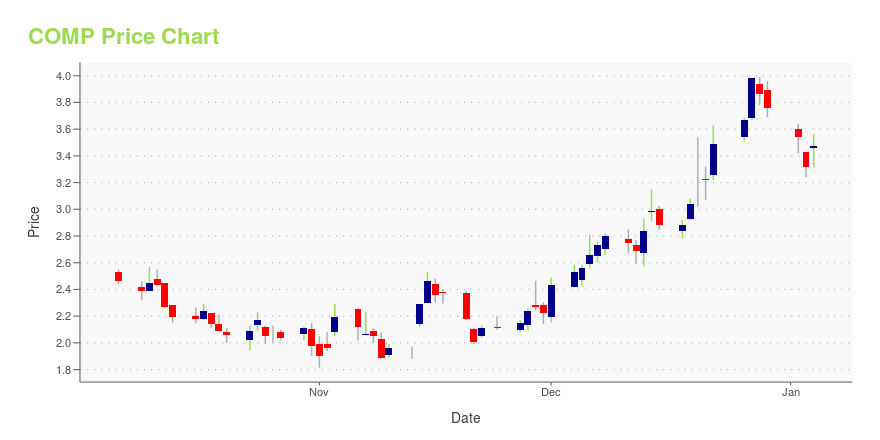
COMP Stock Price Chart Interactive Chart >
Compass Inc. Cl A (COMP) Company Bio
Compass is a real estate technology company that provides an online platform for buying, renting, and selling real estate assets. Its end-to-end platform supports the entire buying and selling workflow. Compass operates in 22+ regions across the United States including New York, Los Angeles, and Orange County, Chicago, San Francisco, Boston, Washington D.C., South Florida, The Hamptons, Santa Barbara & Montecito, San Diego, Seattle & Eastside, Philadelphia, Connecticut, Westchester, Aspen, Boulder, Denver, Atlanta, Austin & Central Texas, Dallas-Fort Worth, Houston, Nashville, and Lake Tahoe.
Latest COMP News From Around the Web
Below are the latest news stories about COMPASS INC that investors may wish to consider to help them evaluate COMP as an investment opportunity.
Dow Jones Futures: Market Rally Edges Higher; Tesla Breaks Out, Apple Watch Scores Big WinThe market rally rose slightly Wednesday with Tesla clearing an entry and AAPL rebounding on an Apple Watch victory. Spotify is among leading stocks finding key support. |
How major US stock indexes fared Wednesday, 12/27/2023The Dow rose 0.3% and the Nasdaq rose 0.2%. The S&P 500 is up more than 24% for the year, while the Nasdaq, which is heavily weighted with technology companies, is up 44%. The Nasdaq composite rose 24.60 points, or 0.2%, to 15,099.18. |
US STOCKS-Wall St ekes out modest gains as S&P 500 hovers near all-time closing highU.S. stocks closed slightly higher in languid trading on Wednesday, with little market-moving news to fuel conviction as the S&P 500 hovered just below bull market confirmation. The S&P 500 ended 0.3% below its record closing high of 4,796.56 reached on Jan. 3, 2022. |
REFILE-US STOCKS-Wall St wavers as S&P 500 hovers near all-time closing highWall Street moved sideways on Wednesday in languid trading, with very little market-moving news to nudge sentiment in either direction as the S&P 500 kept hovering just below bull market confirmation. Volume was light and the three major U.S. stock indexes oscillated between modest gains and losses, with all three on course for monthly, quarterly, and annual gains. "When you have very few catalysts and minimal trading activity you tend to see continuation of the trends," said Chuck Carlson, chief executive officer at Horizon Investment Services in Hammond, Indiana. |
US STOCKS-Wall St wavers heading into year end due to lack of catalystsWall Street's main indexes struggled for direction on Wednesday in the absence of any major catalysts to keep up the optimism around potential rate cuts by the Federal Reserve that briefly drove the S&P 500 close to an all-time high. Two weeks ago, after the Fed signaled the end of its rate hike cycle and opened the door to potential rate cuts in 2024, an eight-week rally in the main indexes went into overdrive. "I'm not quite sure on the timing (of the rate cuts), but what is clear is that they (the Fed) are on a path to cutting rates and that's supportive for valuations across the market," said David Waddell, CEO and chief investment strategist at Waddell and Associates. |
COMP Price Returns
| 1-mo | 23.68% |
| 3-mo | 34.55% |
| 6-mo | 23.33% |
| 1-year | 11.84% |
| 3-year | -65.74% |
| 5-year | N/A |
| YTD | 18.09% |
| 2023 | 61.37% |
| 2022 | -74.37% |
| 2021 | N/A |
| 2020 | N/A |
| 2019 | N/A |
Loading social stream, please wait...