Mr. Cooper Group Inc. (COOP): Price and Financial Metrics
GET POWR RATINGS... FREE!
COOP POWR Grades
- Value is the dimension where COOP ranks best; there it ranks ahead of 74.62% of US stocks.
- COOP's strongest trending metric is Quality; it's been moving up over the last 179 days.
- COOP ranks lowest in Growth; there it ranks in the 0th percentile.
COOP Stock Summary
- COOP's current price/earnings ratio is 2.47, which is higher than only 1.39% of US stocks with positive earnings.
- Price to trailing twelve month operating cash flow for COOP is currently 1.33, higher than only 4.44% of US stocks with positive operating cash flow.
- Shareholder yield, a measure of how much is returned to shareholders via dividends and share repurchases, for COOP comes in at 39.98% -- higher than that of 96.03% of stocks in our set.
- Stocks with similar financial metrics, market capitalization, and price volatility to Mr Cooper Group Inc are MHLD, RDN, BEDU, UGP, and MTG.
- COOP's SEC filings can be seen here. And to visit Mr Cooper Group Inc's official web site, go to mrcoopergroup.com.
COOP Valuation Summary
- In comparison to the median Financial Services stock, COOP's price/earnings ratio is 78.18% lower, now standing at 2.4.
- Over the past 72 months, COOP's price/sales ratio has gone down 80.9.
- COOP's price/sales ratio has moved down 80.9 over the prior 72 months.
Below are key valuation metrics over time for COOP.
Stock | Date | P/S | P/B | P/E | EV/EBIT |
---|---|---|---|---|---|
COOP | 2021-03-30 | 1.1 | 1.2 | 10.2 | 14.0 |
COOP | 2020-05-21 | 0.5 | 0.5 | 3.3 | 15.8 |
COOP | 2019-12-13 | 0.8 | 0.7 | -3.5 | 42.7 |
COOP | 2019-02-04 | 143.2 | 0.7 | 108.3 | 621.8 |
COOP | 2018-01-12 | 28.3 | 0.9 | 1.3 | -2.3 |
COOP | 2017-05-08 | 47.8 | 1.3 | 1.4 | -1.5 |
COOP's Quality Factors
The “Quality” component of the POWR Ratings focuses on 31 different factors of a companies fundamentals and operational strength. Here are some key insights as we drill into the specifics of these quality attributes.- COOP has a Quality Grade of C, ranking ahead of 29.9% of graded US stocks.
- COOP's asset turnover comes in at 0.156 -- ranking 38th of 428 Banking stocks.
- BHLB, CIZN, and WRLD are the stocks whose asset turnover ratios are most correlated with COOP.
The table below shows COOP's key quality metrics over time.
Period | Asset Turnover | Gross Margin | ROIC |
---|---|---|---|
2021-09-30 | 0.156 | 1 | 0.074 |
2021-06-30 | 0.156 | 1 | 0.071 |
2021-03-31 | 0.169 | 1 | 0.061 |
2020-12-31 | 0.135 | 1 | 0.035 |
2020-09-30 | 0.134 | 1 | 0.038 |
2020-06-30 | 0.126 | 1 | 0.034 |
COOP Price Target
For more insight on analysts targets of COOP, see our COOP price target page. And for a list of of all stocks sorted by upside potential based on analyst target price, see our Top Price Target page.
Average Price Target | $44.29 | Average Broker Recommendation | 1.57 (Moderate Buy) |
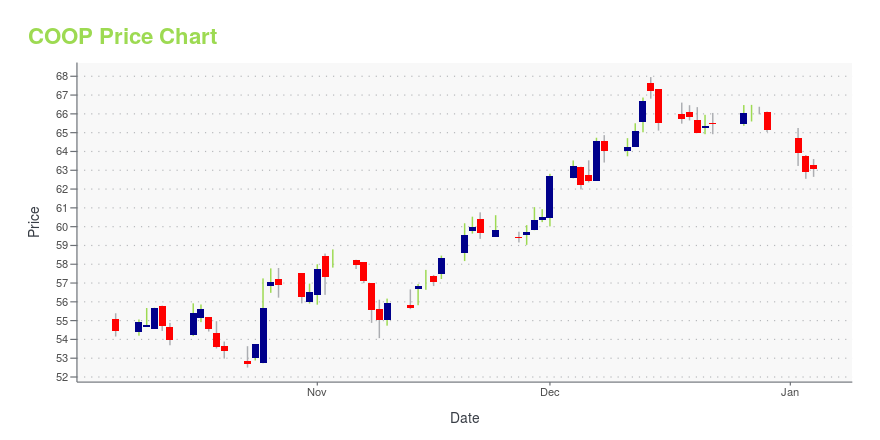
COOP Stock Price Chart Interactive Chart >
COOP Price/Volume Stats
Current price | $42.87 | 52-week high | $52.34 |
Prev. close | $43.53 | 52-week low | $31.79 |
Day low | $41.96 | Volume | 862,400 |
Day high | $43.93 | Avg. volume | 983,070 |
50-day MA | $44.71 | Dividend yield | N/A |
200-day MA | $42.90 | Market Cap | 3.17B |
Mr. Cooper Group Inc. (COOP) Company Bio
Mr. Cooper Group (formerly WMIH Corp) consists primarily of Nationstar Mortgage Holdings Inc., which provides quality servicing, origination and transaction-based services related principally to single-family residences throughout the United States. WMIH Corp. was founded in 1889 and is based in Seattle, Washington.
Latest COOP News From Around the Web
Below are the latest news stories about Mr Cooper Group Inc that investors may wish to consider to help them evaluate COOP as an investment opportunity.
Nationstar Mortgage Holdings Inc. -- Moody's upgrades Nationstar's senior unsecured rating to B1 from B2, assigns a B1 corporate family rating to Mr. Cooper Group Inc.; outlook stableRating Action: Moody's upgrades Nationstar's senior unsecured rating to B1 from B2, assigns a B1 corporate family rating to Mr. Cooper Group Inc.; outlook stableGlobal Credit Research - 18 Feb 2022New York, February 18, 2022 -- Moody's Investors Service ("Moody's") has assigned a B1 corporate family rating (CFR) to Mr. Cooper Group Inc. (Mr. Cooper). The B1 CFR reflects the group's improved financial profile, including profitability and capitalization improvements, and its enhanced capacity to grow its capitalization levels through increased earnings, which improves its ability to absorb unexpected losses. |
7 Value Stocks Primed to Take Off in a Rising Rate EnvironmentThese seven top value stocks could outperform in the coming years, especially against the backdrop of multiple federal interest hikes. |
Mr Cooper: Q4 Earnings SnapshotCOPPELL, Texas (AP) _ Mr. Cooper Group Inc. (COOP) on Friday reported fourth-quarter net income of $155 million. The Coppell, Texas-based company said it had profit of $2.01 per share. Earnings, adjusted for non-recurring gains, were $1.53 per share. The results topped Wall Street expectations. The average estimate of three analysts surveyed by Zacks Investment Research was for earnings of $1.29 per share. The reinsurance company posted revenue of $625 million in the period, also surpassing Street forecasts. Three analysts surveyed by Zacks expected $556.9 million. For the year, the company reported profit of $1.45 billion, or $16.53 per share. Revenue was reported as $3.32 billion. _____ This story was generated by Automated Insights (http://automatedinsights.com/ap) using data from Za... |
Wachtell, Kirkland steer loan servicer Mr. Cooper''s IP deal with fintechWachtell, Lipton, Rosen & Katz is advising Mr. Cooper Group Inc, a large U.S. home loan servicer, on the sale of IP rights for its mortgage servicing technology platform to fintech software company Sagent M&C, which was represented by Kirkland & Ellis. |
Recap: Mr. Cooper Group Q4 EarningsMr. Cooper Group (NASDAQ: COOP ) reported its Q4 earnings results on Friday, February 11, 2022 at 07:00 AM. Here''s what investors need to know about the announcement. Earnings Mr. Cooper Group beat estimated earnings by 24.59%, reporting an EPS of $1.52 … Full story available on Benzinga.com |
COOP Price Returns
1-mo | -4.46% |
3-mo | N/A |
6-mo | 1.85% |
1-year | 29.24% |
3-year | 373.18% |
5-year | 197.71% |
YTD | 3.03% |
2021 | 34.10% |
2020 | 148.04% |
2019 | 7.20% |
2018 | 14.55% |
2017 | -45.23% |
Loading social stream, please wait...