ConocoPhillips (COP): Price and Financial Metrics
GET POWR RATINGS... FREE!
COP POWR Grades
- COP scores best on the Momentum dimension, with a Momentum rank ahead of 99.98% of US stocks.
- The strongest trend for COP is in Growth, which has been heading down over the past 179 days.
- COP ranks lowest in Stability; there it ranks in the 35th percentile.
COP Stock Summary
- COP has a higher market value than 98.16% of US stocks; more precisely, its current market capitalization is $130,849,365,172.
- Of note is the ratio of Conocophillips's sales and general administrative expense to its total operating expenses; merely 3.28% of US stocks have a lower such ratio.
- In terms of twelve month growth in earnings before interest and taxes, Conocophillips is reporting a growth rate of -671.26%; that's higher than merely 3.14% of US stocks.
- Stocks with similar financial metrics, market capitalization, and price volatility to Conocophillips are EQNR, VALE, PTR, SBUX, and DEO.
- COP's SEC filings can be seen here. And to visit Conocophillips's official web site, go to www.conocophillips.com.
COP Valuation Summary
- COP's price/sales ratio is 2.4; this is 60% higher than that of the median Energy stock.
- COP's price/sales ratio has moved up 1.7 over the prior 243 months.
Below are key valuation metrics over time for COP.
Stock | Date | P/S | P/B | P/E | EV/EBIT |
---|---|---|---|---|---|
COP | 2021-09-03 | 2.4 | 1.7 | 40.7 | 21.9 |
COP | 2021-09-02 | 2.4 | 1.7 | 40.9 | 22.1 |
COP | 2021-09-01 | 2.3 | 1.7 | 39.5 | 21.4 |
COP | 2021-08-31 | 2.4 | 1.7 | 40.2 | 21.7 |
COP | 2021-08-30 | 2.4 | 1.7 | 40.7 | 21.9 |
COP | 2021-08-27 | 2.4 | 1.7 | 41.0 | 22.1 |
COP Growth Metrics
- Its 4 year cash and equivalents growth rate is now at -19.69%.
- The 2 year net income to common stockholders growth rate now stands at 754.07%.
- Its 3 year cash and equivalents growth rate is now at 27.78%.

The table below shows COP's growth in key financial areas (numbers in millions of US dollars).
Date | Revenue | Operating Cash Flow | Net Income to Common Stock |
---|---|---|---|
2021-12-31 | 48,349 | 16,996 | 8,079 |
2021-09-30 | 38,435 | 12,800 | 4,680 |
2021-06-30 | 31,199 | 8,871 | 1,851 |
2021-03-31 | 25,004 | 4,777 | 20 |
2020-12-31 | 19,256 | 4,802 | -2,701 |
2020-09-30 | 21,347 | 6,112 | -1,209 |
COP's Quality Factors
The “Quality” component of the POWR Ratings focuses on 31 different factors of a companies fundamentals and operational strength. Here are some key insights as we drill into the specifics of these quality attributes.- COP has a Quality Grade of C, ranking ahead of 67.79% of graded US stocks.
- COP's asset turnover comes in at 0.423 -- ranking 61st of 136 Petroleum and Natural Gas stocks.
- CVI, ROCC, and XOM are the stocks whose asset turnover ratios are most correlated with COP.
The table below shows COP's key quality metrics over time.
Period | Asset Turnover | Gross Margin | ROIC |
---|---|---|---|
2021-06-30 | 0.423 | 0.430 | 0.050 |
2021-03-31 | 0.367 | 0.387 | 0.012 |
2020-12-31 | 0.303 | 0.316 | -0.034 |
2020-09-30 | 0.326 | 0.358 | -0.001 |
2020-06-30 | 0.402 | 0.445 | 0.055 |
2020-03-31 | 0.454 | 0.460 | 0.083 |
COP Price Target
For more insight on analysts targets of COP, see our COP price target page. And for a list of of all stocks sorted by upside potential based on analyst target price, see our Top Price Target page.
Average Price Target | $74.71 | Average Broker Recommendation | 1.43 (Moderate Buy) |
COP Stock Price Chart Interactive Chart >
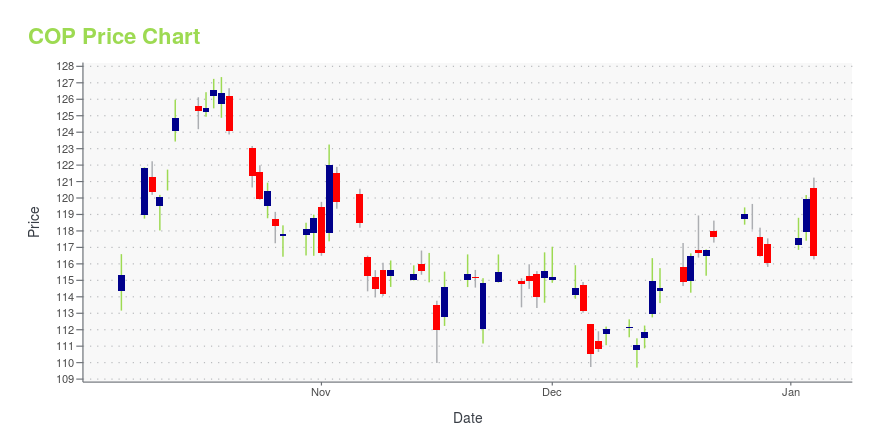
COP Price/Volume Stats
Current price | $114.60 | 52-week high | $114.60 |
Prev. close | $113.15 | 52-week low | $51.41 |
Day low | $111.87 | Volume | 6,788,600 |
Day high | $114.60 | Avg. volume | 8,526,415 |
50-day MA | $101.73 | Dividend yield | 1.61% |
200-day MA | $82.00 | Market Cap | 148.23B |
ConocoPhillips (COP) Company Bio
ConocoPhillips is an American multinational corporation engaged in hydrocarbon exploration. It is based in the Energy Corridor district of Houston, Texas. (Source:Wikipedia)
Latest COP News From Around the Web
Below are the latest news stories about Conocophillips that investors may wish to consider to help them evaluate COP as an investment opportunity.
Stocks Fought Off Huge Losses After Russia Attacked Ukraine. Here’s What Else Happened in the Stock Market Today.The Dow averted a correction, reversing an 800-point drop to end in the green. Tech stocks, which started the day in bear-market territory, led the comeback. |
Oil prices retreat below $100 a barrel following Biden’s remarks on UkraineYahoo Finance's Jared Blikre breaks down the major reversal in the energy markets on Feb. 24. |
Russia-Ukraine crisis could 'negatively impact the U.S. and global recovery,' economist saysMorning Consult Economic Analyst Jesse Wheeler joins Yahoo Finance Live to discuss the global economic impacts of Russia invading Ukraine. |
The Zacks Analyst Blog Highlights ConocoPhillips, Occidental Petroleum, Marathon Oil, Marathon Petroleum and APA CorpConocoPhillips, Occidental Petroleum, Marathon Oil, Marathon Petroleum and APA Corp are included in this blog. |
Diamondback (FANG) Q4 Earnings & Revenues Beat, Dividend UpDiamondback Energy (FANG) outlines a capital spending budget between $1.75 billion and $1.9 billion for 2022, which represents an increase from the 2021 actual figure of $1.5 billion. |
COP Price Returns
1-mo | 18.01% |
3-mo | 26.50% |
6-mo | 61.28% |
1-year | 111.62% |
3-year | 110.12% |
5-year | 189.64% |
YTD | 60.76% |
2021 | 86.60% |
2020 | -36.04% |
2019 | 6.63% |
2018 | 15.63% |
2017 | 11.95% |
COP Dividends
Ex-Dividend Date | Type | Payout Amount | Change | ||||||
---|---|---|---|---|---|---|---|---|---|
Loading, please wait... |
Continue Researching COP
Want to do more research on Conocophillips's stock and its price? Try the links below:Conocophillips (COP) Stock Price | Nasdaq
Conocophillips (COP) Stock Quote, History and News - Yahoo Finance
Conocophillips (COP) Stock Price and Basic Information | MarketWatch
Loading social stream, please wait...