Callon Petroleum Company (CPE): Price and Financial Metrics

Callon Petroleum Company (CPE): $35.60

0.48 (+1.37%)

POWR Rating

Component Grades

Momentum

C

Stability

D

Sentiment

Quality

C

Add CPE to Watchlist
Sign Up

Industry: Energy - Oil & Gas

Industry

D

Ranked

#69 of 85

in industry

CPE Price/Volume Stats

Current price $35.60 52-week high $41.36
Prev. close $35.12 52-week low $28.62
Day low $35.33 Volume 538,700
Day high $36.07 Avg. volume 1,655,411
50-day MA $32.48 Dividend yield N/A
200-day MA $34.57 Market Cap 2.37B

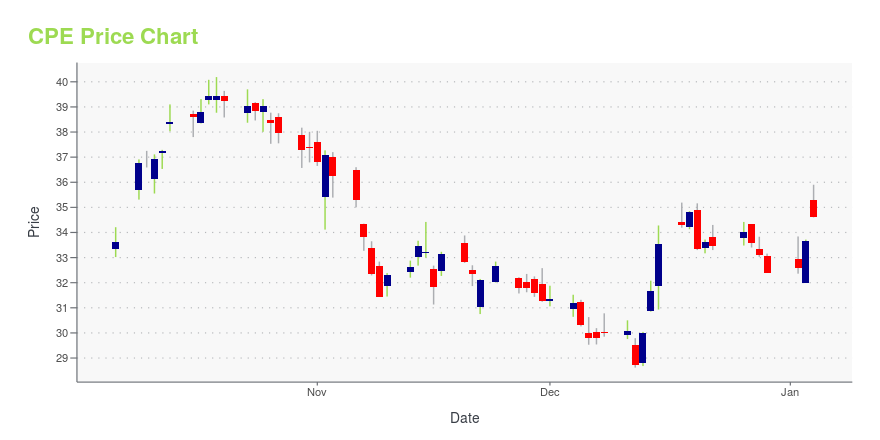
CPE Stock Price Chart Interactive Chart >

CPE POWR Grades

  • CPE scores best on the Value dimension, with a Value rank ahead of 83.21% of US stocks.
  • CPE's strongest trending metric is Value; it's been moving down over the last 26 weeks.
  • CPE's current lowest rank is in the Sentiment metric (where it is better than 1.51% of US stocks).

CPE Stock Summary

  • CPE's current price/earnings ratio is 4.52, which is higher than only 4.35% of US stocks with positive earnings.
  • Price to trailing twelve month operating cash flow for CPE is currently 1.95, higher than only 5.71% of US stocks with positive operating cash flow.
  • Of note is the ratio of CALLON PETROLEUM CO's sales and general administrative expense to its total operating expenses; only 3.48% of US stocks have a lower such ratio.
  • Stocks that are quantitatively similar to CPE, based on their financial statements, market capitalization, and price volatility, are SSL, SBOW, VET, SWN, and CRK.
  • CPE's SEC filings can be seen here. And to visit CALLON PETROLEUM CO's official web site, go to www.callon.com.

CPE Valuation Summary

  • CPE's price/sales ratio is 0.9; this is 33.33% lower than that of the median Energy stock.
  • Over the past 243 months, CPE's EV/EBIT ratio has gone down 5.7.

Below are key valuation metrics over time for CPE.

Stock Date P/S P/B P/E EV/EBIT
CPE 2023-12-28 0.9 0.6 4.4 9.1
CPE 2023-12-27 0.9 0.6 4.5 9.2
CPE 2023-12-26 0.9 0.6 4.6 9.3
CPE 2023-12-22 0.9 0.6 4.5 9.2
CPE 2023-12-21 0.9 0.6 4.5 9.2
CPE 2023-12-20 0.9 0.6 4.5 9.2

CPE Growth Metrics

    Its 3 year revenue growth rate is now at 301.54%.
  • Its year over year price growth rate is now at 28.85%.
  • Its 5 year net income to common stockholders growth rate is now at 2800.63%.
Over the past 67 months, CPE's revenue has gone up $2,967,387,000.

The table below shows CPE's growth in key financial areas (numbers in millions of US dollars).

Date Revenue Operating Cash Flow Net Income to Common Stock
2022-09-30 3,218.903 1,495.18 1,222.7
2022-06-30 2,935.588 1,314.47 844.999
2022-03-31 2,462.367 1,117.748 485.295
2021-12-31 2,045.03 974.143 365.151
2021-09-30 1,647.654 742.411 -425.271
2021-06-30 1,385.118 583.547 -1,277.557

CPE's Quality Factors

The “Quality” component of the POWR Ratings focuses on 31 different factors of a companies fundamentals and operational strength. Here are some key insights as we drill into the specifics of these quality attributes.
  • CPE has a Quality Grade of C, ranking ahead of 61.09% of graded US stocks.
  • CPE's asset turnover comes in at 0.302 -- ranking 83rd of 136 Petroleum and Natural Gas stocks.
  • SD, DWSN, and APA are the stocks whose asset turnover ratios are most correlated with CPE.

The table below shows CPE's key quality metrics over time.

Period Asset Turnover Gross Margin ROIC
2021-06-30 0.302 0.659 -0.168
2021-03-31 0.225 0.622 -0.356
2020-12-31 0.184 0.627 -0.277
2020-09-30 0.147 0.671 -0.205
2020-06-30 0.131 0.708 -0.135
2020-03-31 0.144 0.770 0.058

CPE Price Target

For more insight on analysts targets of CPE, see our CPE price target page. And for a list of of all stocks sorted by upside potential based on analyst target price, see our Top Price Target page.

Average Price Target $45.87 Average Broker Recommendation 1.92 (Hold)

Callon Petroleum Company (CPE) Company Bio


Callon Petroleum Company engages in the exploration, development, acquisition, and production of oil and natural gas properties in the Permian Basin in West Texas. The company was founded in 1950 and is based in Natchez, Mississippi.


CPE Latest News Stream


Event/Time News Detail
Loading, please wait...

CPE Latest Social Stream


Loading social stream, please wait...

View Full CPE Social Stream

Latest CPE News From Around the Web

Below are the latest news stories about CALLON PETROLEUM CO that investors may wish to consider to help them evaluate CPE as an investment opportunity.

The 12% return this week takes Callon Petroleum's (NYSE:CPE) shareholders three-year gains to 139%

Callon Petroleum Company ( NYSE:CPE ) shareholders might be concerned after seeing the share price drop 13% in the last...

Yahoo | December 16, 2023

Permian Explorer Callon Mulls Options Amid Buyer Interest

(Bloomberg) -- Permian Basin explorer Callon Petroleum Co. is considering strategic options amid takeover interest from rival oil and gas players, people familiar with the matter said, as dealmaking accelerates in the US energy industry. Most Read from BloombergNetanyahu, Under Pressure Over Hostage Deaths, Vows to Press OnMike Johnson May Be the Next House Speaker to Lose His Job‘Underwater’ Car Loans Signal US Consumers Slammed by High RatesUS Navy Shoots Down 14-Drone Wave as Shippers Avoid R

Yahoo | December 15, 2023

11 Best Stocks to Buy for the Next 10 Years

In this piece, we will take a look at the 11 best stocks to buy for the next ten years. If you want to skip our take on what’s happening in the stock market right now and some future predictions, then you can take a look at the 5 Best Stocks to Buy for the […]

Yahoo | December 10, 2023

Russell 2000 Front-Runners: 3 Stocks to Keep an Eye On

While all eyes may be on the usual suspects of market hype and influence, astute investors with a contrarian streak may want to consider Russell 2000 stocks.

Josh Enomoto on InvestorPlace | December 8, 2023

Why Is Callon (CPE) Down 15.7% Since Last Earnings Report?

Callon (CPE) reported earnings 30 days ago. What's next for the stock? We take a look at earnings estimates for some clues.

Yahoo | December 1, 2023

Read More 'CPE' Stories Here

CPE Price Returns

1-mo 12.80%
3-mo 9.88%
6-mo -9.00%
1-year 7.52%
3-year -1.85%
5-year -52.85%
YTD 9.88%
2023 -12.64%
2022 -21.50%
2021 259.04%
2020 -72.75%
2019 -25.58%

Continue Researching CPE

Here are a few links from around the web to help you further your research on Callon Petroleum Co's stock as an investment opportunity:

Callon Petroleum Co (CPE) Stock Price | Nasdaq
Callon Petroleum Co (CPE) Stock Quote, History and News - Yahoo Finance
Callon Petroleum Co (CPE) Stock Price and Basic Information | MarketWatch

Get Free Updates

Join thousands of investors who get the latest news, insights and top rated picks from StockNews.com!