China Pharma Holdings, Inc. (CPHI): Price and Financial Metrics
GET POWR RATINGS... FREE!
CPHI Stock Summary
- CPHI has a higher market value than only 2.88% of US stocks; more precisely, its current market capitalization is $19,409,218.
- The price/operating cash flow metric for China Pharma Holdings Inc is higher than 92.73% of stocks in our set with a positive cash flow.
- Revenue growth over the past 12 months for China Pharma Holdings Inc comes in at -11.84%, a number that bests only 10.02% of the US stocks we're tracking.
- If you're looking for stocks that are quantitatively similar to China Pharma Holdings Inc, a group of peers worth examining would be CETX, MGIC, IOSP, ORGO, and OFLX.
- Visit CPHI's SEC page to see the company's official filings. To visit the company's web site, go to www.chinapharmaholdings.com.
CPHI Valuation Summary
- CPHI's EV/EBIT ratio is -10.3; this is 135.15% lower than that of the median Healthcare stock.
- CPHI's price/earnings ratio has moved down 10.5 over the prior 154 months.
- Over the past 154 months, CPHI's price/earnings ratio has gone down 10.5.
Below are key valuation metrics over time for CPHI.
Stock | Date | P/S | P/B | P/E | EV/EBIT |
---|---|---|---|---|---|
CPHI | 2021-08-31 | 3.0 | 4.6 | -7.8 | -10.3 |
CPHI | 2021-08-30 | 2.9 | 4.6 | -7.8 | -10.3 |
CPHI | 2021-08-27 | 3.0 | 4.7 | -8.1 | -10.6 |
CPHI | 2021-08-26 | 3.1 | 4.9 | -8.3 | -10.9 |
CPHI | 2021-08-25 | 3.1 | 4.9 | -8.3 | -10.9 |
CPHI | 2021-08-24 | 3.1 | 4.8 | -8.3 | -10.8 |
CPHI Growth Metrics
- Its 3 year revenue growth rate is now at -36.36%.
- Its 3 year price growth rate is now at 41%.
- Its year over year net income to common stockholders growth rate is now at 85.8%.

The table below shows CPHI's growth in key financial areas (numbers in millions of US dollars).
Date | Revenue | Operating Cash Flow | Net Income to Common Stock |
---|---|---|---|
2021-09-30 | 9.683661 | 0.283142 | -3.627794 |
2021-06-30 | 10.1057 | 0.5096 | -3.811021 |
2021-03-31 | 11.46087 | -0.075021 | -2.973207 |
2020-12-31 | 10.86645 | -0.04226 | -2.866777 |
2020-09-30 | 10.98376 | -1.172494 | -20.403 |
2020-06-30 | 10.95993 | -0.476228 | -20.09405 |
CPHI's Quality Factors
The “Quality” component of the POWR Ratings focuses on 31 different factors of a companies fundamentals and operational strength. Here are some key insights as we drill into the specifics of these quality attributes.- CPHI has a Quality Grade of C, ranking ahead of 56.06% of graded US stocks.
- CPHI's asset turnover comes in at 0.493 -- ranking 88th of 677 Pharmaceutical Products stocks.
- DRNA, ONVO, and CASI are the stocks whose asset turnover ratios are most correlated with CPHI.
The table below shows CPHI's key quality metrics over time.
Period | Asset Turnover | Gross Margin | ROIC |
---|---|---|---|
2021-06-30 | 0.493 | 0.094 | -0.236 |
2021-03-31 | 0.538 | 0.177 | -0.174 |
2020-12-31 | 0.495 | 0.180 | -0.168 |
2020-09-30 | 0.494 | 0.153 | -1.332 |
2020-06-30 | 0.407 | 0.183 | -0.990 |
2020-03-31 | 0.306 | 0.105 | -0.802 |
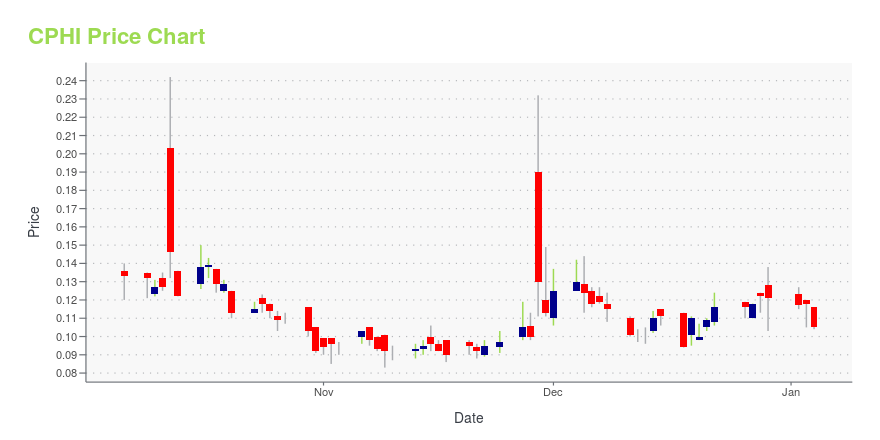
CPHI Stock Price Chart Interactive Chart >
CPHI Price/Volume Stats
Current price | $0.21 | 52-week high | $0.97 |
Prev. close | $0.22 | 52-week low | $0.20 |
Day low | $0.21 | Volume | 108,000 |
Day high | $0.23 | Avg. volume | 201,702 |
50-day MA | $0.25 | Dividend yield | N/A |
200-day MA | $0.42 | Market Cap | 10.37M |
Latest CPHI News From Around the Web
Below are the latest news stories about China Pharma Holdings Inc that investors may wish to consider to help them evaluate CPHI as an investment opportunity.
China Pharma Holdings, Inc. Reports Third Quarter 2021 Financial ResultsChina Pharma Holdings, Inc. (NYSE American: CPHI) ("China Pharma," the "Company" or "We"), an NYSE American-listed corporation with a fully-integrated specialty pharmaceuticals subsidiary based in China, today announced the financial results for the quarter ended September 30, 2021. |
Today’s Biggest Pre-Market Stock Movers: 10 Top Gainers and Losers on ThursdayGood morning, investor! |
China Pharma Holdings, Inc. Reports Second Quarter 2021 Financial ResultsChina Pharma Holdings, Inc. (NYSE American: CPHI) ("China Pharma," the "Company" or "We"), an NYSE American-listed corporation with a fully-integrated specialty pharmaceuticals subsidiary based in China, today announced the financial results for the quarter ended June 30, 2021. |
China Pharma's Candesartan Hypertension Product Passes Bioequivalence Tests and the Company Plans to Apply for NMPA ApprovalChina Pharma Holdings, Inc. (NYSE American: CPHI) ("China Pharma," the "Company" or "We"), a specialty pharmaceutical company, today announced that its Candesartan hypertension product passed key bioequivalence tests. The Company plans to use the results of the key benchmark tests of consistency evaluation to apply for the National Medical Products Administration's (NMPA) approval. The NMPA is the Chinese agency for regulating drugs and medical devices (formerly the China Food and Drug Administr |
China Pharma to Launch Highly Purified NMN+PQQ ProductChina Pharma Holdings, Inc. (NYSE American: CPHI) ("China Pharma," the "Company" or "We"), a specialty pharmaceutical company, today announced plans to launch a highly purified NMN+PQQ product following the recent successful completion of a pilot scale test. β-Nicotinamide mononucleotide (NMN) is a derivative of the B-vitamin niacin, which is believed to significantly improve health and wellness. |
CPHI Price Returns
1-mo | -17.65% |
3-mo | -46.02% |
6-mo | -56.49% |
1-year | -70.60% |
3-year | -28.81% |
5-year | -8.70% |
YTD | -56.49% |
2021 | 8.25% |
2020 | 88.26% |
2019 | -7.86% |
2018 | 42.78% |
2017 | -30.77% |
Continue Researching CPHI
Want to do more research on China Pharma Holdings Inc's stock and its price? Try the links below:China Pharma Holdings Inc (CPHI) Stock Price | Nasdaq
China Pharma Holdings Inc (CPHI) Stock Quote, History and News - Yahoo Finance
China Pharma Holdings Inc (CPHI) Stock Price and Basic Information | MarketWatch
Loading social stream, please wait...