
Corbus Pharmaceuticals Holdings, Inc. (CRBP): Price and Financial Metrics
CRBP Price/Volume Stats
| Current price | $58.06 | 52-week high | $61.18 |
| Prev. close | $55.45 | 52-week low | $3.03 |
| Day low | $56.22 | Volume | 227,885 |
| Day high | $59.72 | Avg. volume | 559,200 |
| 50-day MA | $48.82 | Dividend yield | N/A |
| 200-day MA | $27.45 | Market Cap | 620.49M |
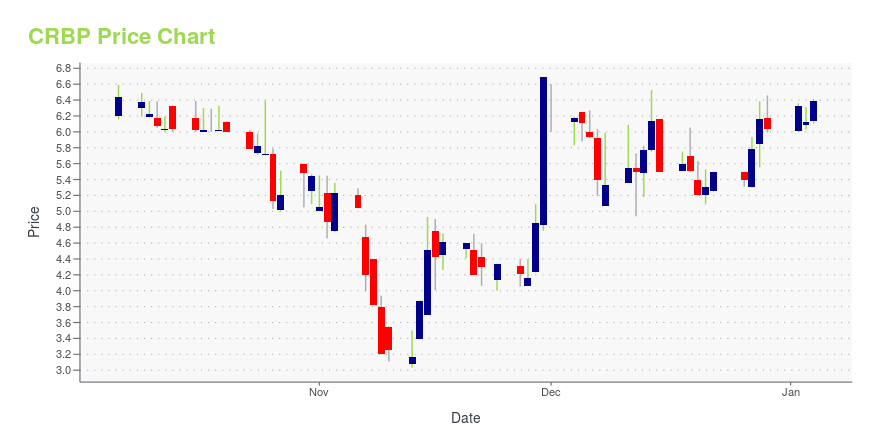
CRBP Stock Price Chart Interactive Chart >
Corbus Pharmaceuticals Holdings, Inc. (CRBP) Company Bio
Corbus Pharmaceuticals Holdings, Inc., a clinical stage pharmaceutical company, focuses on the development and commercialization of novel therapeutics to treat inflammatory and fibrotic diseases. The company is based in Norwood, Massachusetts.
Latest CRBP News From Around the Web
Below are the latest news stories about CORBUS PHARMACEUTICALS HOLDINGS INC that investors may wish to consider to help them evaluate CRBP as an investment opportunity.
Corbus Pharmaceuticals Announces Abstract Accepted for Presentation at 2024 ASCO GUNORWOOD, Mass., Dec. 18, 2023 (GLOBE NEWSWIRE) -- Corbus Pharmaceuticals Holdings, Inc. (NASDAQ: CRBP) (“Corbus” or the “Company”), a precision oncology company with a diversified portfolio, today announced that the Phase 1, first-in-human clinical data from a dose escalation study being carried out by its partner CSPC in China with CRB-701 (SYS6002) has been accepted for presentation at the 2024 American Society of Clinical Oncology Genitourinary Cancers Symposium (ASCO GU), to be held January |
Is Corbus Pharmaceuticals (CRBP) Stock Outpacing Its Medical Peers This Year?Here is how Corbus Pharmaceuticals (CRBP) and CVRx (CVRX) have performed compared to their sector so far this year. |
Corbus Pharmaceuticals Reports Q3 2023 Financial Results with a Net Loss of $10.1 MillionOperating Expenses Increase by $1.3 Million Year-Over-Year |
Corbus Pharmaceuticals Reports Third Quarter 2023 Financial Results and Provides Corporate UpdateData from dose escalation study for CRB-701, a Nectin-4 ADC to treat solid tumors, on track for release in early 2024 along with start of U.S./EU StudyIND Submission for CRB-601, an αvβ8 Monoclonal Antibody to treat solid tumors, on track for Q4 2023Pre-clinical data for CRB-913, a peripherally restricted CB1 inverse agonist, published in Obesity and presented at Obesity Week NORWOOD, Mass., Nov. 07, 2023 (GLOBE NEWSWIRE) -- Corbus Pharmaceuticals Holdings, Inc. (NASDAQ: CRBP) (“Corbus” or the “ |
Corbus Pharmaceuticals Presents Results of Two Pre-Clinical Studies on its Anti-αVβ8 Monoclonal Antibody (CRB-601) at the 2023 SITC Annual MeetingNORWOOD, Mass., Nov. 02, 2023 (GLOBE NEWSWIRE) -- Corbus Pharmaceuticals Holdings, Inc. (NASDAQ: CRBP) (“Corbus” or the “Company”), a precision oncology company, today announced that results from two pre-clinical studies on its CRB-601 anti-aVb8 integrin monoclonal antibody were presented as posters at the 38th Annual Meeting of the Society for Immunotherapy of Cancer (SITC), being held in San Diego, CA November 1-5, 2023. "These latest pre-clinical data continue to demonstrate that CRB-601 has |
CRBP Price Returns
| 1-mo | 33.50% |
| 3-mo | 69.52% |
| 6-mo | 96.88% |
| 1-year | 805.77% |
| 3-year | 39.23% |
| 5-year | -68.22% |
| YTD | 861.26% |
| 2023 | 82.20% |
| 2022 | -82.05% |
| 2021 | -50.74% |
| 2020 | -77.11% |
| 2019 | -6.51% |
Continue Researching CRBP
Here are a few links from around the web to help you further your research on Corbus Pharmaceuticals Holdings Inc's stock as an investment opportunity:Corbus Pharmaceuticals Holdings Inc (CRBP) Stock Price | Nasdaq
Corbus Pharmaceuticals Holdings Inc (CRBP) Stock Quote, History and News - Yahoo Finance
Corbus Pharmaceuticals Holdings Inc (CRBP) Stock Price and Basic Information | MarketWatch
Loading social stream, please wait...