Crawford & Company (CRD.A): Price and Financial Metrics
GET POWR RATINGS... FREE!
CRD.A Stock Summary
- The capital turnover (annual revenue relative to shareholder's equity) for CRD.A is 5.37 -- better than 93.05% of US stocks.
- With a one year PEG ratio of 264.05, Crawford & Co is expected to have a higher PEG ratio (a measure of how expensive a stock is relative to its expected earnings growth) than 90.14% of US stocks.
- With a price/sales ratio of 0.34, Crawford & Co has a higher such ratio than merely 6.68% of stocks in our set.
- Stocks that are quantitatively similar to CRD.A, based on their financial statements, market capitalization, and price volatility, are BBSI, HBB, CENT, ASO, and MYRG.
- CRD.A's SEC filings can be seen here. And to visit Crawford & Co's official web site, go to www.crawfordandcompany.com.
CRD.A Valuation Summary
- In comparison to the median Financial Services stock, CRD.A's price/sales ratio is 58.33% lower, now standing at 0.5.
- Over the past 243 months, CRD.A's price/earnings ratio has gone down 13.
- CRD.A's price/earnings ratio has moved down 13 over the prior 243 months.
Below are key valuation metrics over time for CRD.A.
Stock | Date | P/S | P/B | P/E | EV/EBIT |
---|---|---|---|---|---|
CRD.A | 2020-04-03 | 0.3 | 2.0 | 26.1 | 15.2 |
CRD.A | 2017-10-24 | 0.5 | 3.2 | 15.0 | 10.4 |
CRD.A | 2014-07-17 | 0.4 | 2.2 | 9.1 | 6.9 |
CRD.A | 2012-07-27 | 0.2 | 1.4 | 4.9 | 6.0 |
CRD.A | 2011-02-04 | 0.1 | 2.1 | 6.8 | 7.9 |
CRD.A | 2007-01-30 | 0.3 | 1.4 | 12.5 | 7.7 |
CRD.A Growth Metrics
- Its 4 year cash and equivalents growth rate is now at 54.98%.
- Its year over year net cashflow from operations growth rate is now at 53.99%.
- Its 3 year net cashflow from operations growth rate is now at -7.73%.

The table below shows CRD.A's growth in key financial areas (numbers in millions of US dollars).
Date | Revenue | Operating Cash Flow | Net Income to Common Stock |
---|---|---|---|
2021-12-31 | 1,139.231 | 54.321 | 30.692 |
2021-09-30 | 1,101.867 | 55.905 | 38.439 |
2021-06-30 | 1,065.974 | 91.678 | 51.641 |
2021-03-31 | 1,032.304 | 102.733 | 45.759 |
2020-12-31 | 1,016.195 | 93.178 | 28.296 |
2020-09-30 | 1,008.152 | 90.207 | 11.584 |
CRD.A's Quality Factors
The “Quality” component of the POWR Ratings focuses on 31 different factors of a companies fundamentals and operational strength. Here are some key insights as we drill into the specifics of these quality attributes.- CRD.A has a Quality Grade of C, ranking ahead of 61.04% of graded US stocks.
- CRD.A's asset turnover comes in at 1.404 -- ranking 8th of 133 Insurance stocks.
- AIZ, MMC, and RNR are the stocks whose asset turnover ratios are most correlated with CRD.A.
The table below shows CRD.A's key quality metrics over time.
Period | Asset Turnover | Gross Margin | ROIC |
---|---|---|---|
2021-06-30 | 1.404 | 0.272 | 0.150 |
2021-03-31 | 1.371 | 0.278 | 0.143 |
2020-12-31 | 1.345 | 0.274 | 0.087 |
2020-09-30 | 1.331 | 0.274 | 0.058 |
2020-06-30 | 1.321 | 0.271 | 0.026 |
2020-03-31 | 1.334 | 0.275 | 0.014 |
CRD.A Price Target
For more insight on analysts targets of CRD.A, see our CRD.A price target page. And for a list of of all stocks sorted by upside potential based on analyst target price, see our Top Price Target page.
Average Price Target | $13.00 | Average Broker Recommendation | 1 (Strong Buy) |
CRD.A Stock Price Chart Interactive Chart >
CRD.A Price/Volume Stats
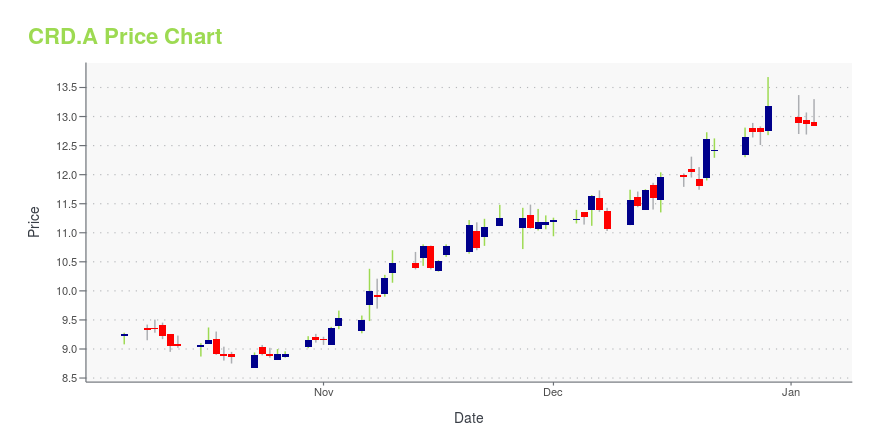
Current price | $8.04 | 52-week high | $11.00 |
Prev. close | $7.89 | 52-week low | $6.96 |
Day low | $8.02 | Volume | 31,900 |
Day high | $8.15 | Avg. volume | 61,459 |
50-day MA | $7.68 | Dividend yield | 2.99% |
200-day MA | $8.18 | Market Cap | 393.70M |
Crawford & Company (CRD.A) Company Bio
Crawford & Company provides claims management solutions for the risk management and insurance industries, and self-insured entities worldwide. The company operates through four segments: U.S. Services, International, Broadspire, and Garden City Group. It offers Crawford Solution, which provides integrated claim, business process outsourcing, and consulting services for various product lines, such as property and casualty claims management, workers compensation claims and medical management, and legal settlement administration. The company was founded in 1941 and is based in Atlanta, Georgia.
Latest CRD.A News From Around the Web
Below are the latest news stories about Crawford & Co that investors may wish to consider to help them evaluate CRD.A as an investment opportunity.
Rohit Verma and Oris R. Stuart elected to Ameritas board of directorsLINCOLN, Neb., Dec. 8, 2021 /PRNewswire/ -- Rohit Verma, chief executive officer and board member of Crawford & Company®, and Oris R. Stuart, chief people and inclusion officer for the National Basketball Association, have been elected to the Ameritas Mutual Holding Company board of |
CRD.A Price Returns
1-mo | 3.08% |
3-mo | 4.54% |
6-mo | 4.03% |
1-year | -14.42% |
3-year | -0.37% |
5-year | 21.50% |
YTD | 9.03% |
2021 | 4.00% |
2020 | -33.93% |
2019 | 32.53% |
2018 | 8.18% |
2017 | -7.03% |
CRD.A Dividends
Ex-Dividend Date | Type | Payout Amount | Change | ||||||
---|---|---|---|---|---|---|---|---|---|
Loading, please wait... |
Continue Researching CRD.A
Want to see what other sources are saying about Crawford & Co's financials and stock price? Try the links below:Crawford & Co (CRD.A) Stock Price | Nasdaq
Crawford & Co (CRD.A) Stock Quote, History and News - Yahoo Finance
Crawford & Co (CRD.A) Stock Price and Basic Information | MarketWatch
Loading social stream, please wait...