
Creative Realities, Inc. (CREX): Price and Financial Metrics
CREX Price/Volume Stats
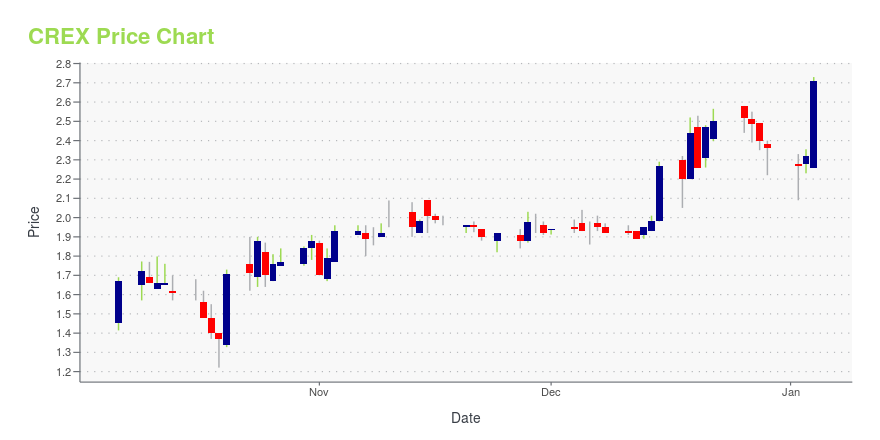
| Current price | $4.97 | 52-week high | $5.20 |
| Prev. close | $4.97 | 52-week low | $1.22 |
| Day low | $4.95 | Volume | 42,200 |
| Day high | $5.08 | Avg. volume | 61,972 |
| 50-day MA | $4.26 | Dividend yield | N/A |
| 200-day MA | $3.19 | Market Cap | 51.92M |
CREX Stock Price Chart Interactive Chart >
Creative Realities, Inc. (CREX) Company Bio
Creative Realities, Inc., together with its subsidiaries, provides digital marketing technology and solutions to retail companies, individual retail brands, enterprises, and other organizations in the United States and Canada. The company's technology and solutions include digital merchandising systems and omni-channel customer engagement systems; interactive digital shopping assistants; advisors and kiosks; and other interactive marketing technologies, such as mobile, social media, point-of-sale transactions, beaconing, and Web-based media that enables its customers to engage with their consumers. It also provides consulting, experience design, content development and production, software development, engineering, implementation, and field services; software licenses; and maintenance and support services related to its software, managed systems, and solutions. The company sells its solutions to the automotive, apparel and accessories, banking, baby/children, beauty, CPG, department stores, digital out-of-home, electronics, fashion, fitness, foodservice/quick service restaurant, financial services, gaming, luxury, mass merchants, mobile operators, and pharmacy retail industries. Creative Realities, Inc. is headquartered in Louisville, Kentucky. Creative Realities, Inc. is a subsidiary of Slipstream Communications, LLC.
Latest CREX News From Around the Web
Below are the latest news stories about CREATIVE REALITIES INC that investors may wish to consider to help them evaluate CREX as an investment opportunity.
Creative Realities and Black Rifle Coffee Join Forces to Revolutionize the Customer ExperienceVeteran-founded coffee chain utilizes digital signage solutions to improve ordering, optimize transactions and deliver valueLOUISVILLE, Ky., Dec. 13, 2023 (GLOBE NEWSWIRE) -- Creative Realities, Inc. (NASDAQ: CREX, CREXW), a leading digital signage solutions provider, announced today it has partnered with veteran-founded Black Rifle Coffee – marking a significant milestone in reshaping the customer experience for Black Rifle Coffee, known for its commitment to supporting US Veterans and its edgy |
Here’s Why Deep Sail Capital Invested in Creative Realities (CREX)Deep Sail Capital, an investment management company, released its third quarter 2023 investor letter. A copy of the same can be downloaded here. In the third quarter, the fund returned -23.3% net of fees while averaging 78% net long exposure. Weakness in micro- and small-cap equities and growth decelerations in certain positions led to the underperformance […] |
Creative Realities illuminates Airport Shopping with Engaging LED ExperiencesBringing visually striking design to Paradies Lagardère stores to captivate travelers this holiday seasonLOUISVILLE, Ky., Nov. 14, 2023 (GLOBE NEWSWIRE) -- Creative Realities, Inc. (NASDAQ: CREX, CREXW), a leading digital signage and media network solutions provider, today announced its collaboration with Paradies Lagardère. With over 700 retail and restaurant locations strategically positioned across more than 90 airports in North America, Paradies Lagardère stands as a beacon of innovation, cr |
Creative Realities, Inc. (NASDAQ:CREX) Q3 2023 Earnings Call TranscriptCreative Realities, Inc. (NASDAQ:CREX) Q3 2023 Earnings Call Transcript November 10, 2023 Creative Realities, Inc. misses on earnings expectations. Reported EPS is $-0.22162 EPS, expectations were $-0.07. Operator: Good morning. At this time, I would like to welcome everyone to the Third Quarter 2023 Creative Realities, Inc. Earnings Conference Call. This call will be recorded […] |
Q3 2023 Creative Realities Inc Earnings CallQ3 2023 Creative Realities Inc Earnings Call |
CREX Price Returns
| 1-mo | 12.95% |
| 3-mo | 42.41% |
| 6-mo | 70.21% |
| 1-year | 27.44% |
| 3-year | -0.80% |
| 5-year | -26.70% |
| YTD | 110.59% |
| 2023 | 35.63% |
| 2022 | -58.57% |
| 2021 | 8.53% |
| 2020 | -15.69% |
| 2019 | -32.89% |
Continue Researching CREX
Want to see what other sources are saying about Creative Realities Inc's financials and stock price? Try the links below:Creative Realities Inc (CREX) Stock Price | Nasdaq
Creative Realities Inc (CREX) Stock Quote, History and News - Yahoo Finance
Creative Realities Inc (CREX) Stock Price and Basic Information | MarketWatch
Loading social stream, please wait...