
Charge Enterprises Inc. (CRGE): Price and Financial Metrics
CRGE Price/Volume Stats
| Current price | $0.02 | 52-week high | $1.32 |
| Prev. close | $0.03 | 52-week low | $0.01 |
| Day low | $0.02 | Volume | 5,663,805 |
| Day high | $0.03 | Avg. volume | 32,318,555 |
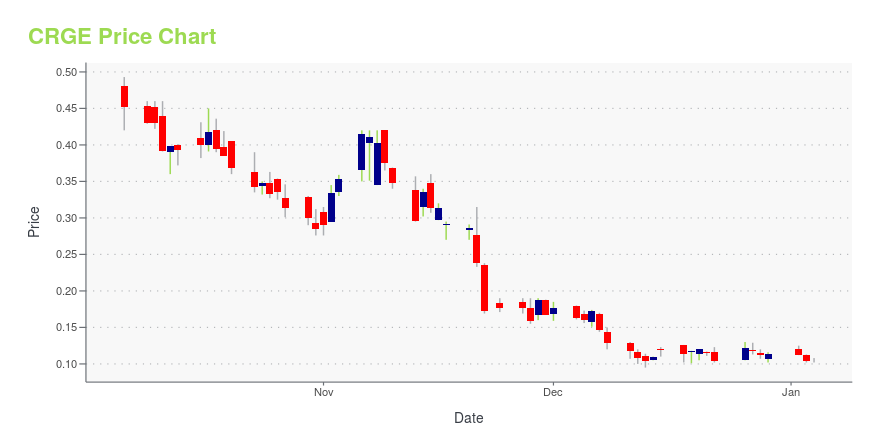
| 50-day MA | $0.10 | Dividend yield | N/A |
| 200-day MA | $0.48 | Market Cap | 4.52M |
CRGE Stock Price Chart Interactive Chart >
Charge Enterprises Inc. (CRGE) Company Bio
Charge Enterprises, Inc. is a portfolio of global businesses with the vision of connecting people everywhere with communications, infrastructure, and charging. Charge Enterprises does the unglamorous part of connecting phone calls and powering the future of movement. It operates through two distinct divisions: Charge Communications, with a strategy to offer Unified Communication as a Service (UCaaS) and Communication as a Platform Service (CPaaS), providing termination of both voice and data to Carriers and Mobile Network Operators (MNO's), and Charge Infrastructure, which includes portable powerbanks, micro-mobility docking and charging & EV charging installation, stations & maintenance.
Latest CRGE News From Around the Web
Below are the latest news stories about CHARGE ENTERPRISES INC that investors may wish to consider to help them evaluate CRGE as an investment opportunity.
Today’s Biggest Pre-Market Stock Movers: 10 Top Gainers and Losers on MondayIt's time to start the trading week with a look at the biggest pre-market stock movers worth watching for Monday morning! |
Georgia’s No. 1 Volume and a Top 10 U.S Ford Dealership Commissions Charge Enterprises for EV Charging and Solar ProjectNEW YORK, December 05, 2023--Charge Enterprises, Inc. (Nasdaq: CRGE) ("Charge" or the "Company"), a leading energy, electrical, broadband and EV charging infrastructure company, has been selected by Akins Ford – Georgia’s largest volume Ford dealer and a top ten Ford U.S. dealership – for the turnkey engineering, procurement, and construction of 19 electric vehicle ("EV") charging stations and a 450 kW DC solar photovoltaic ("PV") system. Greenspeed Energy Solutions, LLC, a Charge Enterprises co |
Charge Enterprises Appoints Matthew Chee as Senior Vice President of GrowthNEW YORK, November 13, 2023--Charge Enterprises, Inc. (Nasdaq: CRGE) ("Charge" or the "Company"), a leading electrical, broadband and EV charging infrastructure company, has announced the expansion of its executive team with the appointment of Matthew Chee as Senior Vice President, Growth. |
What You Need To Know About The Charge Enterprises, Inc. (NASDAQ:CRGE) Analyst Downgrade TodayMarket forces rained on the parade of Charge Enterprises, Inc. ( NASDAQ:CRGE ) shareholders today, when the analysts... |
Charge Enterprises, Inc. (NASDAQ:CRGE) Q3 2023 Earnings Call TranscriptCharge Enterprises, Inc. (NASDAQ:CRGE) Q3 2023 Earnings Call Transcript November 11, 2023 Operator: Good day, everyone, and welcome to Charge Enterprises Third Quarter 2023 Financial Results Webcast. I am Matthew, I’ll be the operator for today’s webcast. Today’s webcast is being broadcast over the Internet and is also recorded for playback purposes. After the speakers’ […] |
CRGE Price Returns
| 1-mo | N/A |
| 3-mo | N/A |
| 6-mo | -86.22% |
| 1-year | -97.95% |
| 3-year | -99.29% |
| 5-year | -98.82% |
| YTD | -82.47% |
| 2023 | -90.80% |
| 2022 | -64.77% |
| 2021 | 93.41% |
| 2020 | -45.67% |
| 2019 | 1,016.67% |
Loading social stream, please wait...