Cirrus Logic, Inc. (CRUS): Price and Financial Metrics
GET POWR RATINGS... FREE!
CRUS POWR Grades
- CRUS scores best on the Value dimension, with a Value rank ahead of 87.37% of US stocks.
- CRUS's strongest trending metric is Growth; it's been moving down over the last 177 days.
- CRUS's current lowest rank is in the Stability metric (where it is better than 29.61% of US stocks).
CRUS Stock Summary
- CIRRUS LOGIC INC's stock had its IPO on March 26, 1990, making it an older stock than 85.87% of US equities in our set.
- Of note is the ratio of CIRRUS LOGIC INC's sales and general administrative expense to its total operating expenses; merely 11.42% of US stocks have a lower such ratio.
- Equity multiplier, or assets relative to shareholders' equity, comes in at 1.32 for CIRRUS LOGIC INC; that's greater than it is for merely 18.94% of US stocks.
- If you're looking for stocks that are quantitatively similar to CIRRUS LOGIC INC, a group of peers worth examining would be TSVT, SELB, AGIO, RAPT, and RGNX.
- Visit CRUS's SEC page to see the company's official filings. To visit the company's web site, go to www.cirrus.com.
CRUS Valuation Summary
- CRUS's EV/EBIT ratio is 11; this is 43.88% lower than that of the median Technology stock.
- Over the past 243 months, CRUS's price/earnings ratio has gone up 14.9.
Below are key valuation metrics over time for CRUS.
Stock | Date | P/S | P/B | P/E | EV/EBIT |
---|---|---|---|---|---|
CRUS | 2023-01-25 | 2.5 | 3.0 | 13.9 | 11.0 |
CRUS | 2023-01-24 | 2.5 | 3.0 | 14.0 | 11.1 |
CRUS | 2023-01-23 | 2.5 | 3.0 | 14.0 | 11.1 |
CRUS | 2023-01-20 | 2.4 | 2.9 | 13.5 | 10.7 |
CRUS | 2023-01-19 | 2.4 | 2.8 | 13.4 | 10.6 |
CRUS | 2023-01-18 | 2.4 | 2.9 | 13.5 | 10.7 |
CRUS Growth Metrics
- Its 5 year net cashflow from operations growth rate is now at -20%.
- Its 2 year revenue growth rate is now at 39.05%.
- The 4 year price growth rate now stands at 13.49%.

The table below shows CRUS's growth in key financial areas (numbers in millions of US dollars).
Date | Revenue | Operating Cash Flow | Net Income to Common Stock |
---|---|---|---|
2022-09-30 | 1,972.534 | 232.73 | 350.945 |
2022-06-30 | 1,897.846 | 225.914 | 348.853 |
2022-03-31 | 1,781.46 | 124.753 | 326.355 |
2021-12-31 | 1,585.025 | 39.025 | 255.222 |
2021-09-30 | 1,522.471 | 309.184 | 241.954 |
2021-06-30 | 1,403.91 | 321.647 | 216.344 |
CRUS's Quality Factors
The “Quality” component of the POWR Ratings focuses on 31 different factors of a companies fundamentals and operational strength. Here are some key insights as we drill into the specifics of these quality attributes.- CRUS has a Quality Grade of B, ranking ahead of 83.77% of graded US stocks.
- CRUS's asset turnover comes in at 0.791 -- ranking 80th of 208 Electronic Equipment stocks.
- IIN, VCRA, and MRVL are the stocks whose asset turnover ratios are most correlated with CRUS.
The table below shows CRUS's key quality metrics over time.
Period | Asset Turnover | Gross Margin | ROIC |
---|---|---|---|
2021-09-25 | 0.791 | 0.509 | 0.270 |
2021-06-26 | 0.783 | 0.513 | 0.227 |
2021-03-27 | 0.782 | 0.517 | 0.230 |
2020-12-26 | 0.802 | 0.521 | 0.218 |
2020-09-26 | 0.756 | 0.524 | 0.173 |
2020-06-27 | 0.795 | 0.528 | 0.202 |
CRUS Price Target
For more insight on analysts targets of CRUS, see our CRUS price target page. And for a list of of all stocks sorted by upside potential based on analyst target price, see our Top Price Target page.
Average Price Target | $105.83 | Average Broker Recommendation | 1.54 (Moderate Buy) |
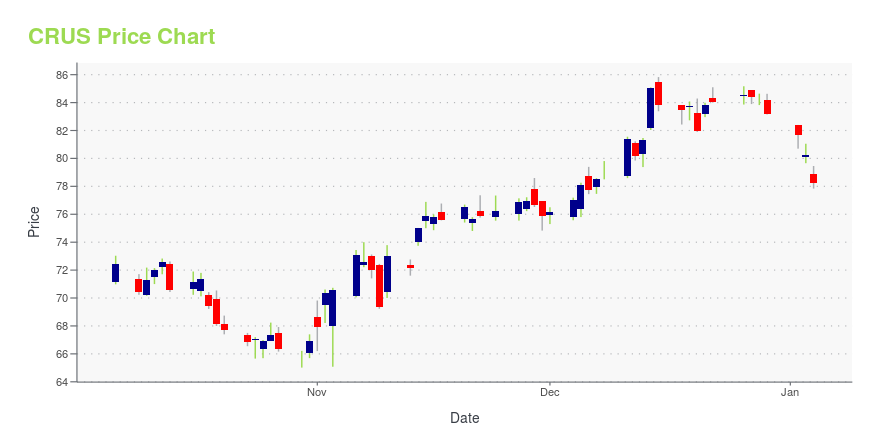
CRUS Stock Price Chart Interactive Chart >
CRUS Price/Volume Stats
Current price | $89.70 | 52-week high | $90.67 |
Prev. close | $90.08 | 52-week low | $61.94 |
Day low | $88.83 | Volume | 329,900 |
Day high | $90.21 | Avg. volume | 456,433 |
50-day MA | $78.39 | Dividend yield | N/A |
200-day MA | $76.55 | Market Cap | 4.94B |
Cirrus Logic, Inc. (CRUS) Company Bio
Cirrus Logic Inc. develops analog and mixed-signal integrated circuits used in audio and energy-related applications. The company was founded in 1984 and is based in Austin, Texas.
Latest CRUS News From Around the Web
Below are the latest news stories about CIRRUS LOGIC INC that investors may wish to consider to help them evaluate CRUS as an investment opportunity.
Cirrus Logic, Inc. (CRUS) Hit a 52 Week High, Can the Run Continue?Cirrus Logic (CRUS) is at a 52-week high, but can investors hope for more gains in the future? We take a look at the company's fundamentals for clues. |
Calculating The Fair Value Of Cirrus Logic, Inc. (NASDAQ:CRUS)How far off is Cirrus Logic, Inc. ( NASDAQ:CRUS ) from its intrinsic value? Using the most recent financial data, we'll... |
Cirrus Logic to Report Third Quarter Fiscal 2023 ResultsCirrus Logic Inc. (NASDAQ: CRUS) today announced that the company will post its third quarter fiscal year 2023 financial results and business outlook on the Investor Relations area of its website on Thursday, Feb. 2, at approximately 4 p.m. EST. Cirrus Logic will host a live Q&A webcast session at 6 p.m. EST that same day to answer questions related to its financial results and business outlook. |
4 Undervalued Tech Stocks to Buy on Market Recovery OptimismUndervalued stocks like JBL, CRUS, ASUR and BCOV may witness a sharp rebound as easing inflationary pressure and gasoline prices boost confidence over broader market recovery in 2023. |
Here's Why You Need to Keep an Eye on Cirrus Logic (CRUS)Cirrus Logic's (CRUS) performance is benefiting from increasing demand for its high-performance mixed-signal segment. |
CRUS Price Returns
1-mo | 20.44% |
3-mo | 33.64% |
6-mo | 6.73% |
1-year | 5.22% |
3-year | 7.17% |
5-year | 78.08% |
YTD | 20.44% |
2022 | -19.06% |
2021 | 11.95% |
2020 | -0.25% |
2019 | 148.37% |
2018 | -36.02% |
Continue Researching CRUS
Want to do more research on Cirrus Logic Inc's stock and its price? Try the links below:Cirrus Logic Inc (CRUS) Stock Price | Nasdaq
Cirrus Logic Inc (CRUS) Stock Quote, History and News - Yahoo Finance
Cirrus Logic Inc (CRUS) Stock Price and Basic Information | MarketWatch
Loading social stream, please wait...