CoStar Group, Inc. (CSGP): Price and Financial Metrics
GET POWR RATINGS... FREE!
CSGP POWR Grades
- Sentiment is the dimension where CSGP ranks best; there it ranks ahead of 89.63% of US stocks.
- The strongest trend for CSGP is in Momentum, which has been heading down over the past 179 days.
- CSGP's current lowest rank is in the Value metric (where it is better than 16.16% of US stocks).
CSGP Stock Summary
- CSGP has a market capitalization of $27,487,194,321 -- more than approximately 90.29% of US stocks.
- With a price/earnings ratio of 93.95, Costar Group Inc P/E ratio is greater than that of about 92.81% of stocks in our set with positive earnings.
- Price to trailing twelve month operating cash flow for CSGP is currently 58.52, higher than 91.48% of US stocks with positive operating cash flow.
- Stocks with similar financial metrics, market capitalization, and price volatility to Costar Group Inc are CERN, EXPE, GGG, HOLX, and FTV.
- Visit CSGP's SEC page to see the company's official filings. To visit the company's web site, go to www.costargroup.com.
CSGP Valuation Summary
- CSGP's price/sales ratio is 19; this is 192.31% higher than that of the median Real Estate stock.
- Over the past 243 months, CSGP's price/sales ratio has gone up 14.6.
- CSGP's price/sales ratio has moved up 14.6 over the prior 243 months.
Below are key valuation metrics over time for CSGP.
Stock | Date | P/S | P/B | P/E | EV/EBIT |
---|---|---|---|---|---|
CSGP | 2021-09-02 | 19.0 | 6.2 | 150.1 | 95.6 |
CSGP | 2021-09-01 | 19.0 | 6.2 | 149.6 | 95.2 |
CSGP | 2021-08-31 | 18.5 | 6.1 | 145.9 | 92.7 |
CSGP | 2021-08-30 | 18.3 | 6.0 | 144.6 | 91.8 |
CSGP | 2021-08-27 | 18.2 | 5.9 | 143.3 | 90.8 |
CSGP | 2021-08-26 | 18.1 | 5.9 | 142.6 | 90.4 |
CSGP Growth Metrics
- Its 3 year price growth rate is now at 143.92%.
- Its 3 year revenue growth rate is now at 65.66%.
- Its 4 year net income to common stockholders growth rate is now at 1461.09%.

The table below shows CSGP's growth in key financial areas (numbers in millions of US dollars).
Date | Revenue | Operating Cash Flow | Net Income to Common Stock |
---|---|---|---|
2021-12-31 | 1,944.135 | 469.731 | 292.564 |
2021-09-30 | 1,881.742 | 449.986 | 235.453 |
2021-06-30 | 1,808.043 | 457.749 | 229.335 |
2021-03-31 | 1,724.869 | 442.495 | 228.547 |
2020-12-31 | 1,659.019 | 486.106 | 227.128 |
2020-09-30 | 1,589.352 | 463.101 | 279.266 |
CSGP's Quality Factors
The “Quality” component of the POWR Ratings focuses on 31 different factors of a companies fundamentals and operational strength. Here are some key insights as we drill into the specifics of these quality attributes.- CSGP has a Quality Grade of C, ranking ahead of 74.83% of graded US stocks.
- CSGP's asset turnover comes in at 0.268 -- ranking 454th of 561 Business Services stocks.
- SABR, TSRI, and MA are the stocks whose asset turnover ratios are most correlated with CSGP.
The table below shows CSGP's key quality metrics over time.
Period | Asset Turnover | Gross Margin | ROIC |
---|---|---|---|
2021-09-30 | 0.268 | 0.814 | 0.249 |
2021-06-30 | 0.261 | 0.815 | 0.239 |
2021-03-31 | 0.254 | 0.815 | 0.238 |
2020-12-31 | 0.267 | 0.814 | 0.231 |
2020-09-30 | 0.291 | 0.808 | 0.343 |
2020-06-30 | 0.324 | 0.803 | 0.483 |
CSGP Price Target
For more insight on analysts targets of CSGP, see our CSGP price target page. And for a list of of all stocks sorted by upside potential based on analyst target price, see our Top Price Target page.
Average Price Target | $102.10 | Average Broker Recommendation | 1.33 (Strong Buy) |
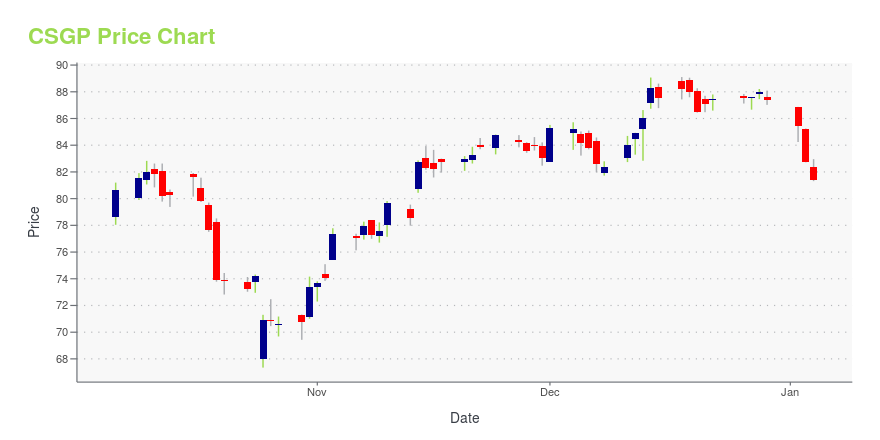
CSGP Stock Price Chart Interactive Chart >
CSGP Price/Volume Stats
Current price | $61.32 | 52-week high | $101.05 |
Prev. close | $60.41 | 52-week low | $49.00 |
Day low | $60.11 | Volume | 1,031,800 |
Day high | $61.53 | Avg. volume | 2,397,132 |
50-day MA | $59.67 | Dividend yield | N/A |
200-day MA | $71.34 | Market Cap | 24.30B |
CoStar Group, Inc. (CSGP) Company Bio
CoStar Group provides information, analytics, and online marketplaces services to the commercial real estate industry in the United States, Canada, the United Kingdom, and France. The company was founded in 1987 and is based in Washington, the District of Columbia.
Latest CSGP News From Around the Web
Below are the latest news stories about Costar Group Inc that investors may wish to consider to help them evaluate CSGP as an investment opportunity.
CoStar Group's (CSGP) CEO Andy Florance on Q4 2021 Results - Earnings Call TranscriptCoStar Group, Inc. (CSGP) Q4 2021 Earnings Conference Call February 22, 2022 5:00 PM ET Company Participants Bill Warmington – Vice President of Investor Relations Andy Florance – Chief Executive Officer and Founder Scott Wheeler – Chief Financial Officer Conference Call Participants Sterling Auty – JPMorgan Chase & Co. Ashish... |
CoStar stock falls 10% as FY22 revenue, EPS outlook seen below estimatesCoStar Group (CSGP -10.0%) stock declined following its Q4 results, which beat analysts' estimates. FY21 revenue rose 17% Y/Y to $1.66B. Net income grew 29% Y/Y to $293M. "Net sales bookings for CoStar in the fourth quarter were virtually in-line with the record level of net sales bookings CoStar delivered in the third quarter... |
These Stocks are the Biggest Pre-Market Movers on WednesdayLosers page, we’ve identified the top five pre-market stock movers, as detailed below. Biggest Movers CoStar Group, Inc. (CSGP) was the biggest laggard in the pre-market trading session, as the stock plummeted around 24% at the time of writing. Despite upbeat fourth-quarter 2021 results, the negative sentiment followed the company’s disappointing guidance. For the first quarter of 2022, CoStar expects earnings of $0.27 to $0.28 per share against the consensus estimate of $0.30 per share. |
CoStar Dips 21.5% Despite Q4 Results BeatShares of CoStar Group, Inc. (CSGP) tanked 21.5% in Tuesday’s extended trading session after the company provided a disappointing outlook for full-year 2022. Nevertheless, the commercial real estate information and online marketplaces provider was able to surpass revenue and earnings estimates. During the quarter, adjusted earnings jumped 20.7% year-over-year to $0.35 per share and surpassed analysts’ expectations of $0.29 per share. Similarly, revenues increased 14.2% year-on-year to $507 million, topping the Street’s estimate of $503.1 million. The company said that net sales bookings in the fourth quarter of 2021 reached an all-time high of $67 million. Adjusted EBITDA came in at $193.4 million, compared to $166. |
Today’s Biggest Pre-Market Stock Movers: 10 Top Gainers and Losers on WednesdayGood morning, trader! |
CSGP Price Returns
1-mo | -4.17% |
3-mo | -7.09% |
6-mo | -22.22% |
1-year | -25.74% |
3-year | 8.44% |
5-year | 132.63% |
YTD | -22.41% |
2021 | -14.50% |
2020 | 54.48% |
2019 | 77.36% |
2018 | 13.60% |
2017 | 57.54% |
Continue Researching CSGP
Want to do more research on Costar Group Inc's stock and its price? Try the links below:Costar Group Inc (CSGP) Stock Price | Nasdaq
Costar Group Inc (CSGP) Stock Quote, History and News - Yahoo Finance
Costar Group Inc (CSGP) Stock Price and Basic Information | MarketWatch
Loading social stream, please wait...