
CSG Systems International, Inc. (CSGS): Price and Financial Metrics
CSGS Price/Volume Stats
| Current price | $45.95 | 52-week high | $69.35 |
| Prev. close | $45.64 | 52-week low | $39.56 |
| Day low | $45.52 | Volume | 250,621 |
| Day high | $46.53 | Avg. volume | 295,208 |
| 50-day MA | $42.00 | Dividend yield | 2.69% |
| 200-day MA | $48.45 | Market Cap | 1.36B |
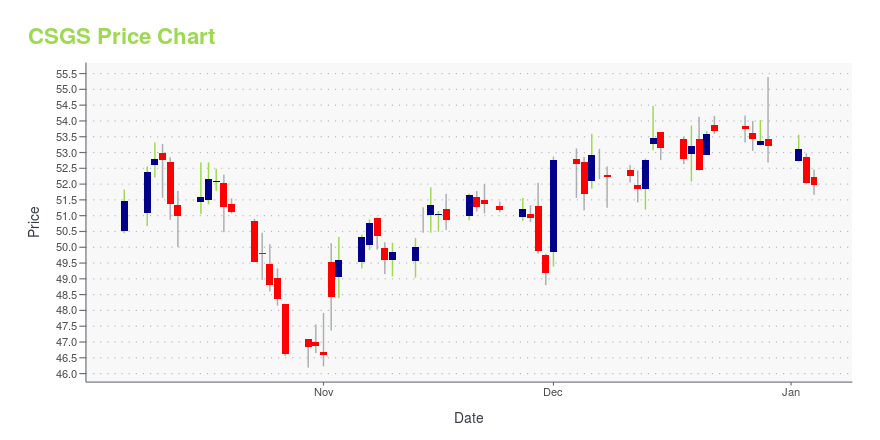
CSGS Stock Price Chart Interactive Chart >
CSG Systems International, Inc. (CSGS) Company Bio
CSG Systems International provides solutions to coordinate and manage many aspects of a service provider's customer interactions, from the initial activation of customer accounts, to the support of various service activities, and through the presentment, collection, and accounts receivables management of monthly customer statements. The company was founded in 1994 and is based in Englewood, Colorado.
Latest CSGS News From Around the Web
Below are the latest news stories about CSG SYSTEMS INTERNATIONAL INC that investors may wish to consider to help them evaluate CSGS as an investment opportunity.
CSG Systems International, Inc.'s (NASDAQ:CSGS) Intrinsic Value Is Potentially 66% Above Its Share PriceKey Insights The projected fair value for CSG Systems International is US$89.32 based on 2 Stage Free Cash Flow to... |
CSG Systems International to Hold Fourth Quarter and Full-Year 2023 Earnings Conference Call on February 7DENVER, December 19, 2023--CSG® (NASDAQ: CSGS) invites you to participate in a conference call on Wednesday, February 7, 2024, at 5:00 p.m. ET to discuss the company's fourth quarter and full-year 2023 earnings results. The conference call will feature CSG president and chief executive officer Brian Shepherd and CSG chief financial officer Hai Tran. |
Zacks Industry Outlook Highlights CACI International, Perficient and CSG SystemsCACI International, Perficient and CSG Systems are part of the Zacks Industry Outlook article. |
3 Stocks to Watch From the Challenging Computer-Services IndustryThe Zacks Computer - Services industry players like CACI, PRFT and CSGS are poised to benefit from digital transformation despite macroeconomic headwinds. |
CSG Pledges Carbon Neutrality, Underscoring Commitment to a Sustainable FutureDENVER, December 12, 2023--CSG (NASDAQ: CSGS) today proudly declares its commitment to leading the charge toward a sustainable future by achieving carbon neutrality in Scope 1 & 2 emissions by 2035. This target signifies a pivotal step in the company’s unwavering dedication to environmental stewardship and corporate responsibility. |
CSGS Price Returns
| 1-mo | 11.85% |
| 3-mo | -3.68% |
| 6-mo | -10.24% |
| 1-year | -8.95% |
| 3-year | 8.37% |
| 5-year | -1.66% |
| YTD | -12.50% |
| 2023 | -4.92% |
| 2022 | 1.10% |
| 2021 | 30.55% |
| 2020 | -11.06% |
| 2019 | 66.00% |
CSGS Dividends
| Ex-Dividend Date | Type | Payout Amount | Change | ||||||
|---|---|---|---|---|---|---|---|---|---|
| Loading, please wait... | |||||||||
Continue Researching CSGS
Want to see what other sources are saying about Csg Systems International Inc's financials and stock price? Try the links below:Csg Systems International Inc (CSGS) Stock Price | Nasdaq
Csg Systems International Inc (CSGS) Stock Quote, History and News - Yahoo Finance
Csg Systems International Inc (CSGS) Stock Price and Basic Information | MarketWatch
Loading social stream, please wait...