
CSP Inc. (CSPI): Price and Financial Metrics
CSPI Price/Volume Stats
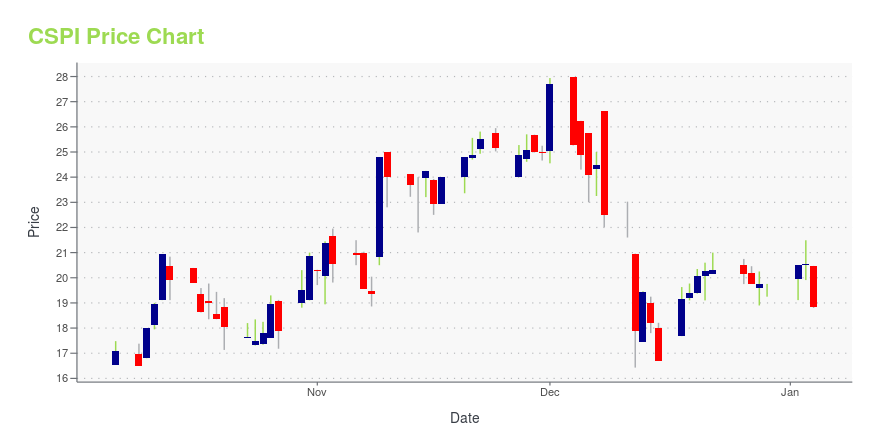
| Current price | $15.13 | 52-week high | $29.92 |
| Prev. close | $14.95 | 52-week low | $6.12 |
| Day low | $14.96 | Volume | 20,500 |
| Day high | $15.54 | Avg. volume | 113,695 |
| 50-day MA | $14.77 | Dividend yield | 0.77% |
| 200-day MA | $14.06 | Market Cap | 147.58M |
CSPI Stock Price Chart Interactive Chart >
Latest CSPI News From Around the Web
Below are the latest news stories about CSP INC that investors may wish to consider to help them evaluate CSPI as an investment opportunity.
Some Confidence Is Lacking In CSP Inc. (NASDAQ:CSPI) As Shares Slide 30%CSP Inc. ( NASDAQ:CSPI ) shareholders won't be pleased to see that the share price has had a very rough month, dropping... |
There's A Lot To Like About CSP's (NASDAQ:CSPI) Upcoming US$0.04 DividendCSP Inc. ( NASDAQ:CSPI ) is about to trade ex-dividend in the next four days. The ex-dividend date is usually set to be... |
CSP Inc. (NASDAQ:CSPI) Q4 2023 Earnings Call TranscriptCSP Inc. (NASDAQ:CSPI) Q4 2023 Earnings Call Transcript December 12, 2023 Operator: Greetings, and welcome to CSPI’s Fourth Quarter and Fiscal Year 2023 Conference Call. At this time, all participants are in a listen-only mode, and a question-and-answer session will follow the formal presentation. [Operator Instructions] Please note this conference is being recorded. Please note, […] |
Q4 2023 CSP Inc Earnings CallQ4 2023 CSP Inc Earnings Call |
CSPI Stock Earnings: CSP Reported Results for Q4 2023CSP just reported results for the fourth quarter of 2023. |
CSPI Price Returns
| 1-mo | 9.08% |
| 3-mo | 12.04% |
| 6-mo | 22.77% |
| 1-year | 143.15% |
| 3-year | 191.47% |
| 5-year | 128.48% |
| YTD | 55.65% |
| 2023 | 108.93% |
| 2022 | 8.03% |
| 2021 | 13.71% |
| 2020 | -40.11% |
| 2019 | 41.77% |
CSPI Dividends
| Ex-Dividend Date | Type | Payout Amount | Change | ||||||
|---|---|---|---|---|---|---|---|---|---|
| Loading, please wait... | |||||||||
Continue Researching CSPI
Want to do more research on Csp Inc's stock and its price? Try the links below:Csp Inc (CSPI) Stock Price | Nasdaq
Csp Inc (CSPI) Stock Quote, History and News - Yahoo Finance
Csp Inc (CSPI) Stock Price and Basic Information | MarketWatch
Loading social stream, please wait...