CASTLE BIOSCIENCES INC (CSTL): Price and Financial Metrics
GET POWR RATINGS... FREE!
CSTL POWR Grades
- Value is the dimension where CSTL ranks best; there it ranks ahead of 57.69% of US stocks.
- The strongest trend for CSTL is in Stability, which has been heading up over the past 177 days.
- CSTL ranks lowest in Momentum; there it ranks in the 1st percentile.
CSTL Stock Summary
- For CSTL, its debt to operating expenses ratio is greater than that reported by just 12.22% of US equities we're observing.
- Equity multiplier, or assets relative to shareholders' equity, comes in at 1.11 for CASTLE BIOSCIENCES INC; that's greater than it is for just 9.04% of US stocks.
- With a year-over-year growth in debt of 64.75%, CASTLE BIOSCIENCES INC's debt growth rate surpasses 84.65% of about US stocks.
- Stocks that are quantitatively similar to CSTL, based on their financial statements, market capitalization, and price volatility, are LMND, ONTF, WRAP, MGNI, and NVVE.
- CSTL's SEC filings can be seen here. And to visit CASTLE BIOSCIENCES INC's official web site, go to castlebiosciences.com.
CSTL Valuation Summary
- CSTL's price/sales ratio is 4.4; this is 131.58% higher than that of the median Healthcare stock.
- Over the past 45 months, CSTL's price/sales ratio has gone down 10.1.
Below are key valuation metrics over time for CSTL.
Stock | Date | P/S | P/B | P/E | EV/EBIT |
---|---|---|---|---|---|
CSTL | 2023-03-24 | 4.4 | 1.5 | -8.9 | -7.1 |
CSTL | 2023-03-23 | 4.3 | 1.5 | -8.8 | -7.0 |
CSTL | 2023-03-22 | 4.2 | 1.4 | -8.5 | -6.7 |
CSTL | 2023-03-21 | 4.3 | 1.5 | -8.9 | -7.0 |
CSTL | 2023-03-20 | 4.1 | 1.4 | -8.4 | -6.6 |
CSTL | 2023-03-17 | 4.1 | 1.4 | -8.5 | -6.7 |
CSTL's Quality Factors
The “Quality” component of the POWR Ratings focuses on 31 different factors of a companies fundamentals and operational strength. Here are some key insights as we drill into the specifics of these quality attributes.- CSTL has a Quality Grade of D, ranking ahead of 17.49% of graded US stocks.
- CSTL's asset turnover comes in at 0.205 -- ranking 69th of 81 Healthcare stocks.
- 500 - Internal server error
The table below shows CSTL's key quality metrics over time.
Period | Asset Turnover | Gross Margin | ROIC |
---|---|---|---|
2021-06-30 | 0.205 | 0.848 | -1.507 |
2021-03-31 | 0.211 | 0.848 | -0.890 |
2020-12-31 | 0.258 | 0.845 | -0.387 |
2020-09-30 | 0.386 | 0.857 | -0.011 |
2020-06-30 | 0.451 | 0.868 | 0.367 |
2020-03-31 | 0.627 | 0.866 | 0.356 |
CSTL Price Target
For more insight on analysts targets of CSTL, see our CSTL price target page. And for a list of of all stocks sorted by upside potential based on analyst target price, see our Top Price Target page.
Average Price Target | $88.50 | Average Broker Recommendation | 1.17 (Strong Buy) |
CSTL Stock Price Chart Interactive Chart >
CSTL Price/Volume Stats
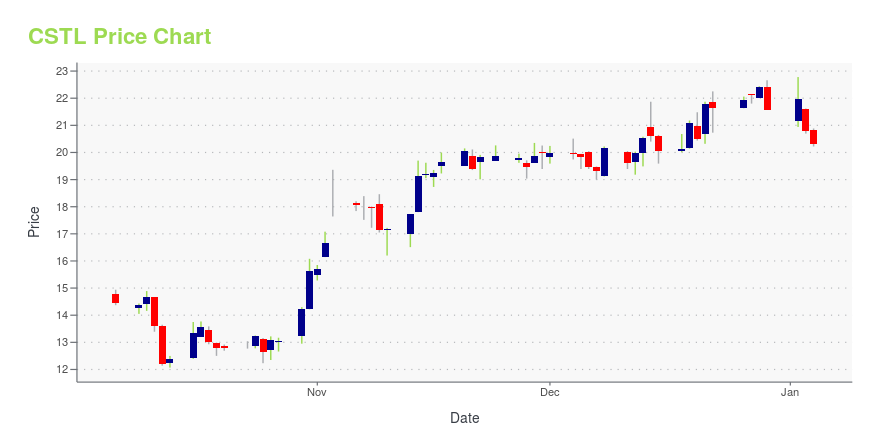
Current price | $22.23 | 52-week high | $47.27 |
Prev. close | $22.45 | 52-week low | $15.58 |
Day low | $22.04 | Volume | 88,500 |
Day high | $22.70 | Avg. volume | 150,144 |
50-day MA | $24.39 | Dividend yield | N/A |
200-day MA | $24.92 | Market Cap | 590.78M |
CASTLE BIOSCIENCES INC (CSTL) Company Bio
Castle Biosciences, Inc. provides healthcare imaging services. The Company offers diagnostic and prognostic testing solutions for cancers, as well as research and development activities. Castle Biosciences serves customers in the United States.
Latest CSTL News From Around the Web
Below are the latest news stories about CASTLE BIOSCIENCES INC that investors may wish to consider to help them evaluate CSTL as an investment opportunity.
7 Value Stocks to Buy for Long-Term GrowthIf you have the patience to ride out some choppy weather, these value stocks to buy may offer significant upside later. |
Castle Biosciences, Inc. (NASDAQ:CSTL) is largely controlled by institutional shareholders who own 85% of the companyKey Insights Significantly high institutional ownership implies Castle Biosciences' stock price is sensitive to their... |
Late-Breaking Data Presented at the 2023 AAD Annual Meeting Demonstrates Improved Accuracy of DecisionDx®-SCC in Predicting Metastatic Risk Over Traditional Staging Systems in Independent, Multi-Center Cohort StudyFRIENDSWOOD, Texas, March 18, 2023--Castle shared new data demonstrating how the independent risk-stratification of DecisionDx®-SCC can significantly improve metastatic risk predictions. |
Castle Biosciences to Present at the KeyBanc Capital Markets Virtual Life Sciences & MedTech Investor ForumFRIENDSWOOD, Texas, March 14, 2023--Castle will present a company overview at the KeyBanc Capital Markets Virtual Life Sciences & MedTech Investor Forum on March 22 at 2:15 p.m. Eastern. |
Castle Biosciences to Highlight Clinical Value of Its Skin Cancer Tests at the 2023 American Academy of Dermatology (AAD) Annual MeetingFRIENDSWOOD, Texas, March 10, 2023--Castle will share new data supporting its portfolio of skin cancer GEP tests at the 2023 American Academy of Dermatology (AAD) Annual Meeting. |
CSTL Price Returns
1-mo | -2.76% |
3-mo | -5.56% |
6-mo | -14.76% |
1-year | -50.45% |
3-year | -25.43% |
5-year | N/A |
YTD | -5.56% |
2022 | -45.09% |
2021 | -36.16% |
2020 | 95.37% |
2019 | N/A |
2018 | N/A |
Loading social stream, please wait...