CSX Corp. (CSX): Price and Financial Metrics
CSX Price/Volume Stats
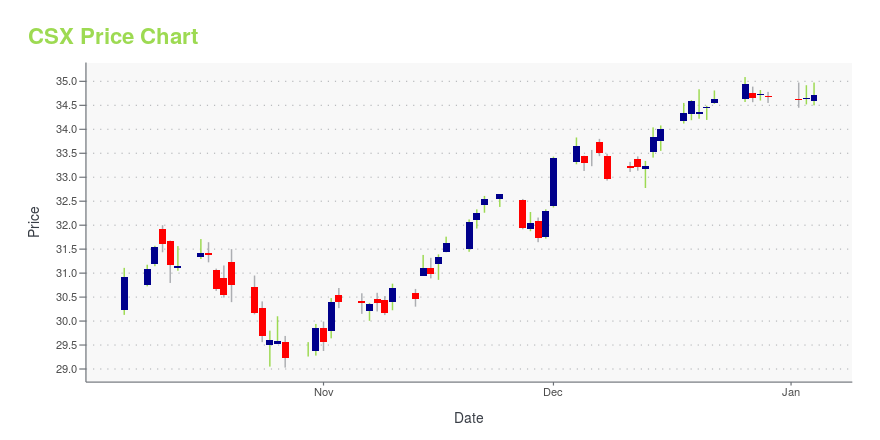
Current price | $36.97 | 52-week high | $40.12 |
Prev. close | $36.84 | 52-week low | $29.03 |
Day low | $36.69 | Volume | 2,692,688 |
Day high | $37.09 | Avg. volume | 11,565,295 |
50-day MA | $36.90 | Dividend yield | 1.3% |
200-day MA | $33.31 | Market Cap | 72.37B |
CSX Stock Price Chart Interactive Chart >
CSX POWR Grades
- CSX scores best on the Quality dimension, with a Quality rank ahead of 91.09% of US stocks.
- CSX's strongest trending metric is Growth; it's been moving down over the last 26 weeks.
- CSX ranks lowest in Growth; there it ranks in the 8th percentile.
CSX Stock Summary
- CSX has a market capitalization of $68,492,701,673 -- more than approximately 96.28% of US stocks.
- Of note is the ratio of CSX CORP's sales and general administrative expense to its total operating expenses; only 0.17% of US stocks have a lower such ratio.
- In terms of volatility of its share price, CSX is more volatile than merely 3.8% of stocks we're observing.
- Stocks that are quantitatively similar to CSX, based on their financial statements, market capitalization, and price volatility, are SO, PCG, DUK, SRE, and D.
- Visit CSX's SEC page to see the company's official filings. To visit the company's web site, go to www.csx.com.
CSX Valuation Summary
- CSX's price/earnings ratio is 17.8; this is 21.24% lower than that of the median Industrials stock.
- CSX's EV/EBIT ratio has moved down 4.5 over the prior 243 months.
Below are key valuation metrics over time for CSX.
Stock | Date | P/S | P/B | P/E | EV/EBIT |
---|---|---|---|---|---|
CSX | 2023-12-29 | 4.7 | 5.7 | 17.8 | 14.7 |
CSX | 2023-12-28 | 4.7 | 5.7 | 17.8 | 14.7 |
CSX | 2023-12-27 | 4.7 | 5.7 | 17.8 | 14.7 |
CSX | 2023-12-26 | 4.7 | 5.8 | 18.0 | 14.8 |
CSX | 2023-12-22 | 4.7 | 5.7 | 17.8 | 14.7 |
CSX | 2023-12-21 | 4.6 | 5.7 | 17.7 | 14.6 |
CSX Growth Metrics
- The year over year net cashflow from operations growth rate now stands at 19.67%.
- Its year over year cash and equivalents growth rate is now at -34.48%.
- Its 5 year price growth rate is now at 24.03%.
The table below shows CSX's growth in key financial areas (numbers in millions of US dollars).
Date | Revenue | Operating Cash Flow | Net Income to Common Stock |
---|---|---|---|
2022-12-31 | 14,853 | 5,619 | 4,166 |
2022-09-30 | 14,550 | 5,535 | 4,082 |
2022-06-30 | 13,947 | 5,230 | 3,939 |
2022-03-31 | 13,122 | 5,166 | 3,934 |
2021-12-31 | 12,522 | 5,099 | 3,781 |
2021-09-30 | 11,920 | 4,954 | 3,607 |
CSX's Quality Factors
The “Quality” component of the POWR Ratings focuses on 31 different factors of a companies fundamentals and operational strength. Here are some key insights as we drill into the specifics of these quality attributes.- CSX has a Quality Grade of B, ranking ahead of 91.24% of graded US stocks.
- CSX's asset turnover comes in at 0.299 -- ranking 68th of 137 Transportation stocks.
- NSC, UNP, and PTSI are the stocks whose asset turnover ratios are most correlated with CSX.
The table below shows CSX's key quality metrics over time.
Period | Asset Turnover | Gross Margin | ROIC |
---|---|---|---|
2021-09-30 | 0.299 | 0.421 | 0.106 |
2021-06-30 | 0.284 | 0.424 | 0.100 |
2021-03-31 | 0.267 | 0.407 | 0.084 |
2020-12-31 | 0.270 | 0.412 | 0.085 |
2020-09-30 | 0.274 | 0.402 | 0.085 |
2020-06-30 | 0.284 | 0.401 | 0.088 |
CSX Price Target
For more insight on analysts targets of CSX, see our CSX price target page. And for a list of of all stocks sorted by upside potential based on analyst target price, see our Top Price Target page.
Average Price Target | $36.26 | Average Broker Recommendation | 1.56 (Moderate Buy) |
CSX Corp. (CSX) Company Bio
CSX Corporation is an American holding company focused on rail transportation and real estate in North America, among other industries. The company was established in 1980 as part of the Chessie System and Seaboard Coast Line Industries merger. The various railroads of the former Chessie System and Seaboard Coast Line Industries that are now owned by CSX Corporation were eventually merged into a single line in 1986 and it became known as CSX Transportation. CSX Corporation currently has a number of subsidiaries beyond CSX Transportation. Based in Richmond, Virginia, USA after the merger, in 2003 the CSX Corporation headquarters moved to Jacksonville, Florida. CSX is a Fortune 500 company. (Source:Wikipedia)
Latest CSX News From Around the Web
Below are the latest news stories about CSX CORP that investors may wish to consider to help them evaluate CSX as an investment opportunity.
14 Most Profitable Industrial Stocks NowIn this piece, we will take a look at the 14 most profitable industrial stocks to buy now. If you want to skip our overview of the industrial sector and some recent developments, then take a look at 5 Most Profitable Industrial Stocks Now. The industrial sector plays a fundamental role in the U.S. economy, […] |
15 Stocks under $50 to Buy and Hold ForeverIn this article, we will take a look at 15 stocks under $50 to buy and hold forever. To skip our analysis of the recent market activity, you can go directly to see the 5 Stocks under $50 to Buy and Hold Forever. Analysts and experts often advise against choosing stocks solely based on their price […] |
Here's Why Investors Should Hold on to CSX Stock CurrentlyCSX's pro-investor stance bodes well. Weakness in the intermodal segment raises concerns. |
CSX Corp's Dividend AnalysisCSX Corp (NASDAQ:CSX) recently announced a dividend of $0.11 per share, payable on 2023-12-15, with the ex-dividend date set for 2023-11-29. As investors look forward to this upcoming payment, the spotlight also shines on the company's dividend history, yield, and growth rates. Using the data from GuruFocus, let's look into CSX Corp's dividend performance and assess its sustainability. |
CSX eyes wheel bearing as cause of Kentucky derailmentA failed wheel bearing may have caused the derailment of a CSX train in Kentucky last week. The post CSX eyes wheel bearing as cause of Kentucky derailment appeared first on FreightWaves. |
CSX Price Returns
1-mo | -2.30% |
3-mo | 6.97% |
6-mo | 21.02% |
1-year | 26.67% |
3-year | 19.02% |
5-year | 57.81% |
YTD | 6.97% |
2023 | 13.51% |
2022 | -16.58% |
2021 | 25.46% |
2020 | 27.09% |
2019 | 18.06% |
CSX Dividends
Ex-Dividend Date | Type | Payout Amount | Change | ||||||
---|---|---|---|---|---|---|---|---|---|
Loading, please wait... |
Loading social stream, please wait...