
Catalent Inc. (CTLT): Price and Financial Metrics
CTLT Price/Volume Stats
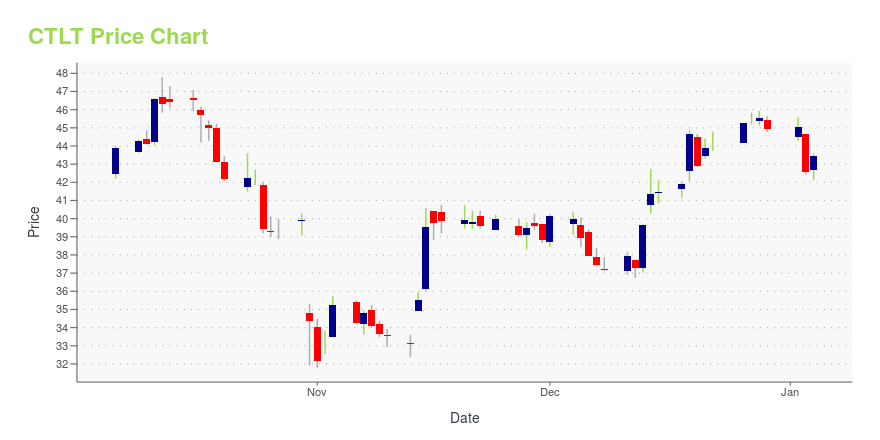
| Current price | $58.68 | 52-week high | $60.20 |
| Prev. close | $58.45 | 52-week low | $31.80 |
| Day low | $58.29 | Volume | 3,004,922 |
| Day high | $58.72 | Avg. volume | 2,198,710 |
| 50-day MA | $56.21 | Dividend yield | N/A |
| 200-day MA | $50.99 | Market Cap | 10.62B |
CTLT Stock Price Chart Interactive Chart >
Catalent Inc. (CTLT) Company Bio
Catalent, Inc. (Catalent Pharma Solutions) is a multinational corporation headquartered in Somerset, New Jersey. It is a global provider of delivery technologies, development, drug manufacturing, biologics, gene therapies and consumer health products. It employs more than 14,000 people, including approximately 2,400 scientists and technicians. In fiscal year 2020, it generated over $3 billion in annual revenue. (Source:Wikipedia)
Latest CTLT News From Around the Web
Below are the latest news stories about CATALENT INC that investors may wish to consider to help them evaluate CTLT as an investment opportunity.
Catalent Announces Closing of Incremental Term LoansSOMERSET, N.J., December 19, 2023--Catalent, Inc. (NYSE: CTLT), the leader in enabling the development and supply of better treatments for patients worldwide, announced today that its wholly owned subsidiary, Catalent Pharma Solutions, Inc., as borrower, and certain other wholly owned subsidiaries of Catalent, entered into an amendment, dated as of December 19, 2023, to its existing credit agreement for the issuance of new incremental term loans in an aggregate amount of $600 million, which was |
Catalent (CTLT) Up 4.1% Since Last Earnings Report: Can It Continue?Catalent (CTLT) reported earnings 30 days ago. What's next for the stock? We take a look at earnings estimates for some clues. |
Here's Why You Should Retain Catalent (CTLT) Stock for NowCatalent's (CTLT) products and services portfolio and technology foundation raise optimism about the stock. |
Catalent Regains Compliance with NYSE Continued Listing StandardsSOMERSET, N.J., December 15, 2023--Catalent, Inc. ("Catalent" or the "Company") (NYSE: CTLT) announced today that the Company has received written notification ("Notice") from the New York Stock Exchange ("NYSE") that it has officially regained compliance with the NYSE continued listing standards. |
Why Analysts Are Bullish on Intel and Target Stock, Cautious on Advance Auto PartsRESEARCH REPORTS These reports, excerpted and edited by Barron’s, were issued recently by investment and research firms. The reports are a sampling of analysts’ thinking; they should not be considered the views or recommendations of Barron’s. |
CTLT Price Returns
| 1-mo | 4.49% |
| 3-mo | 4.94% |
| 6-mo | 12.35% |
| 1-year | 23.17% |
| 3-year | -48.53% |
| 5-year | 2.48% |
| YTD | 30.60% |
| 2023 | -0.18% |
| 2022 | -64.84% |
| 2021 | 23.02% |
| 2020 | 84.85% |
| 2019 | 80.56% |
Continue Researching CTLT
Here are a few links from around the web to help you further your research on Catalent Inc's stock as an investment opportunity:Catalent Inc (CTLT) Stock Price | Nasdaq
Catalent Inc (CTLT) Stock Quote, History and News - Yahoo Finance
Catalent Inc (CTLT) Stock Price and Basic Information | MarketWatch
Loading social stream, please wait...