
CytomX Therapeutics, Inc. (CTMX): Price and Financial Metrics
CTMX Price/Volume Stats
| Current price | $1.50 | 52-week high | $5.85 |
| Prev. close | $1.42 | 52-week low | $1.04 |
| Day low | $1.43 | Volume | 572,600 |
| Day high | $1.51 | Avg. volume | 3,508,727 |
| 50-day MA | $1.51 | Dividend yield | N/A |
| 200-day MA | $1.70 | Market Cap | 116.88M |
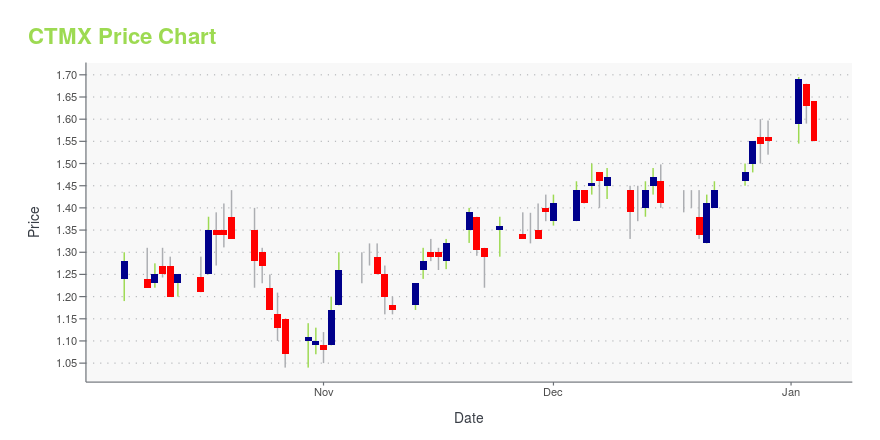
CTMX Stock Price Chart Interactive Chart >
CytomX Therapeutics, Inc. (CTMX) Company Bio
CytomX Therapeutics develops a novel class of antibody therapeutics based on its Probody technology platform that address clinically-validated cancer targets in immuno-oncology. The company was founded in 2008 and is based in San Francisco, California.
Latest CTMX News From Around the Web
Below are the latest news stories about CYTOMX THERAPEUTICS INC that investors may wish to consider to help them evaluate CTMX as an investment opportunity.
CytomX Therapeutics to Present at the 42nd Annual J.P. Morgan Healthcare ConferenceSOUTH SAN FRANCISCO, Calif., Dec. 21, 2023 (GLOBE NEWSWIRE) -- CytomX Therapeutics, Inc. (Nasdaq: CTMX), a leader in the field of conditionally activated, localized biologics, today announced that Sean McCarthy, D.Phil., president, chief executive officer, and chairman, will present at the 42nd Annual J.P. Morgan Healthcare Conference on Wednesday, January 10, 2024 at 5:15 p.m. PT. A live webcast of the presentation will be available on the Events and Presentations page of CytomX’s website at ww |
Investors in CytomX Therapeutics (NASDAQ:CTMX) have unfortunately lost 90% over the last five yearsCytomX Therapeutics, Inc. ( NASDAQ:CTMX ) shareholders should be happy to see the share price up 26% in the last month... |
Pfizer (PFE), Arvinas Post Upbeat Data From Breast Cancer StudyInterim data from an early-stage study shows that treatment with Pfizer (PFE)/Arvinas' (ARVN) breast cancer combination therapy demonstrates encouraging clinical activity in heavily pre-treated patients. |
Alterity (ATHE) Up on Preclinical Parkinson's Treatment DataData from a preclinical study shows that treatment with Alterity's (ATHE) lead candidate improved motor performance and general function in monkeys with experimentally-induced Parkinson's disease. |
CRISPR (CRSP) to Focus on Next-Generation CAR T PipelineBased on early data from ongoing clinical studies, CRISPR (CRSP) has decided to focus on the development of its next-generation CAR T pipeline and discontinue its first-generation CAR T candidates. |
CTMX Price Returns
| 1-mo | 23.97% |
| 3-mo | -5.66% |
| 6-mo | -5.66% |
| 1-year | -12.28% |
| 3-year | -72.43% |
| 5-year | -85.27% |
| YTD | -3.23% |
| 2023 | -3.13% |
| 2022 | -63.05% |
| 2021 | -33.89% |
| 2020 | -21.18% |
| 2019 | -44.97% |
Continue Researching CTMX
Want to do more research on CytomX Therapeutics Inc's stock and its price? Try the links below:CytomX Therapeutics Inc (CTMX) Stock Price | Nasdaq
CytomX Therapeutics Inc (CTMX) Stock Quote, History and News - Yahoo Finance
CytomX Therapeutics Inc (CTMX) Stock Price and Basic Information | MarketWatch
Loading social stream, please wait...