CareTrust REIT, Inc. (CTRE): Price and Financial Metrics
CTRE Price/Volume Stats
Current price | $22.88 | 52-week high | $23.26 |
Prev. close | $23.08 | 52-week low | $17.86 |
Day low | $22.74 | Volume | 2,031,000 |
Day high | $23.26 | Avg. volume | 852,008 |
50-day MA | $21.71 | Dividend yield | 4.89% |
200-day MA | $20.25 | Market Cap | 2.73B |
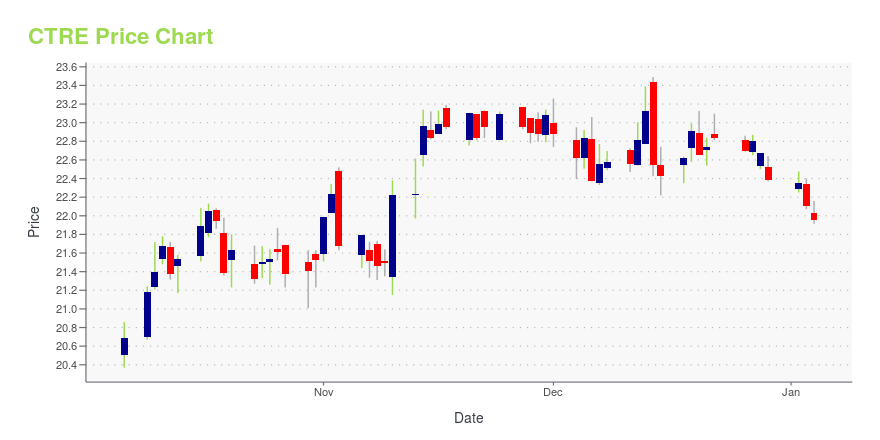
CTRE Stock Price Chart Interactive Chart >
CTRE POWR Grades
- CTRE scores best on the Growth dimension, with a Growth rank ahead of 75.56% of US stocks.
- CTRE's strongest trending metric is Quality; it's been moving down over the last 177 days.
- CTRE's current lowest rank is in the Value metric (where it is better than 6.8% of US stocks).
CTRE Stock Summary
- CTRE's price/sales ratio is 12.61; that's higher than the P/S ratio of 92.69% of US stocks.
- In terms of twelve month growth in earnings before interest and taxes, CARETRUST REIT INC is reporting a growth rate of 274.13%; that's higher than 95.51% of US stocks.
- The volatility of CARETRUST REIT INC's share price is greater than that of merely 2.79% US stocks with at least 200 days of trading history.
- If you're looking for stocks that are quantitatively similar to CARETRUST REIT INC, a group of peers worth examining would be DEA, UDR, KIM, INSW, and NHI.
- Visit CTRE's SEC page to see the company's official filings. To visit the company's web site, go to www.caretrustreit.com.
CTRE Valuation Summary
- CTRE's price/sales ratio is 10.5; this is 150% higher than that of the median Real Estate stock.
- Over the past 115 months, CTRE's price/sales ratio has gone up 2.5.
Below are key valuation metrics over time for CTRE.
Stock | Date | P/S | P/B | P/E | EV/EBIT |
---|---|---|---|---|---|
CTRE | 2023-11-07 | 10.5 | 2.6 | 63.2 | 41.5 |
CTRE | 2023-11-06 | 10.6 | 2.7 | 64.1 | 41.9 |
CTRE | 2023-11-03 | 10.6 | 2.7 | 63.7 | 41.7 |
CTRE | 2023-11-02 | 10.8 | 2.7 | 65.4 | 42.5 |
CTRE | 2023-11-01 | 10.7 | 2.7 | 64.7 | 42.1 |
CTRE | 2023-10-31 | 10.5 | 2.6 | 63.3 | 41.5 |
CTRE Growth Metrics
- Its year over year net cashflow from operations growth rate is now at 10.01%.
- Its 3 year revenue growth rate is now at 21.82%.
- Its 3 year price growth rate is now at -28.13%.

The table below shows CTRE's growth in key financial areas (numbers in millions of US dollars).
Date | Revenue | Operating Cash Flow | Net Income to Common Stock |
---|---|---|---|
2022-12-31 | 196.132 | 144.415 | -7.506 |
2022-09-30 | 194.059 | 149.18 | -3.625 |
2022-06-30 | 192.371 | 154.616 | 7.584 |
2022-03-31 | 193.076 | 157.501 | 8.232 |
2021-12-31 | 192.351 | 156.871 | 71.982 |
2021-09-30 | 186.751 | 155.713 | 74.776 |
CTRE's Quality Factors
The “Quality” component of the POWR Ratings focuses on 31 different factors of a companies fundamentals and operational strength. Here are some key insights as we drill into the specifics of these quality attributes.- CTRE has a Quality Grade of C, ranking ahead of 74.37% of graded US stocks.
- CTRE's asset turnover comes in at 0.113 -- ranking 181st of 444 Trading stocks.
- ABR, JEF, and MPW are the stocks whose asset turnover ratios are most correlated with CTRE.
The table below shows CTRE's key quality metrics over time.
Period | Asset Turnover | Gross Margin | ROIC |
---|---|---|---|
2021-06-30 | 0.113 | 1 | 0.049 |
2021-03-31 | 0.119 | 1 | 0.051 |
2020-12-31 | 0.120 | 1 | 0.052 |
2020-09-30 | 0.120 | 1 | 0.053 |
2020-06-30 | 0.110 | 1 | 0.037 |
2020-03-31 | 0.110 | 1 | 0.038 |
CTRE Price Target
For more insight on analysts targets of CTRE, see our CTRE price target page. And for a list of of all stocks sorted by upside potential based on analyst target price, see our Top Price Target page.
Average Price Target | $26.39 | Average Broker Recommendation | 1.39 (Strong Buy) |
CareTrust REIT, Inc. (CTRE) Company Bio
Caretrust REIT is engaged in the ownership, acquisition and leasing of seniors housing and healthcare-related properties. The company was established in 2014 and is based in San Clemente, California.
Latest CTRE News From Around the Web
Below are the latest news stories about CARETRUST REIT INC that investors may wish to consider to help them evaluate CTRE as an investment opportunity.
CareTrust REIT Announces Third Quarter 2023 Operating ResultsSAN CLEMENTE, Calif., November 09, 2023--CareTrust REIT Announces Third Quarter 2023 Operating Results |
CareTrust REIT Sets Third Quarter Earnings Call for Friday, November 10, 2023SAN CLEMENTE, Calif., November 03, 2023--CareTrust REIT Sets Third Quarter Earnings Call for Friday, November 10, 2023 |
The 7 Best REITs To Buy Now: October 2023These are seven different REITs that investors should be looking to buy. |
7 Affordable Stocks to Invest in as America’s Population AgesStocks for an aging population include some surprisingly youthful products and firms not commonly associated with seniors. |
CareTrust Publishes Third Annual Corporate Sustainability ReportSAN CLEMENTE, Calif., October 11, 2023--CareTrust Publishes Third Annual Corporate Sustainability Report |
CTRE Price Returns
1-mo | 2.92% |
3-mo | 13.40% |
6-mo | 20.75% |
1-year | 19.84% |
3-year | 32.26% |
5-year | 45.24% |
YTD | 28.55% |
2022 | -13.67% |
2021 | 7.91% |
2020 | 13.67% |
2019 | 16.31% |
2018 | 15.89% |
CTRE Dividends
Ex-Dividend Date | Type | Payout Amount | Change | ||||||
---|---|---|---|---|---|---|---|---|---|
Loading, please wait... |
Continue Researching CTRE
Want to do more research on CareTrust REIT Inc's stock and its price? Try the links below:CareTrust REIT Inc (CTRE) Stock Price | Nasdaq
CareTrust REIT Inc (CTRE) Stock Quote, History and News - Yahoo Finance
CareTrust REIT Inc (CTRE) Stock Price and Basic Information | MarketWatch
Loading social stream, please wait...