
Corteva Inc. (CTVA): Price and Financial Metrics
CTVA Price/Volume Stats
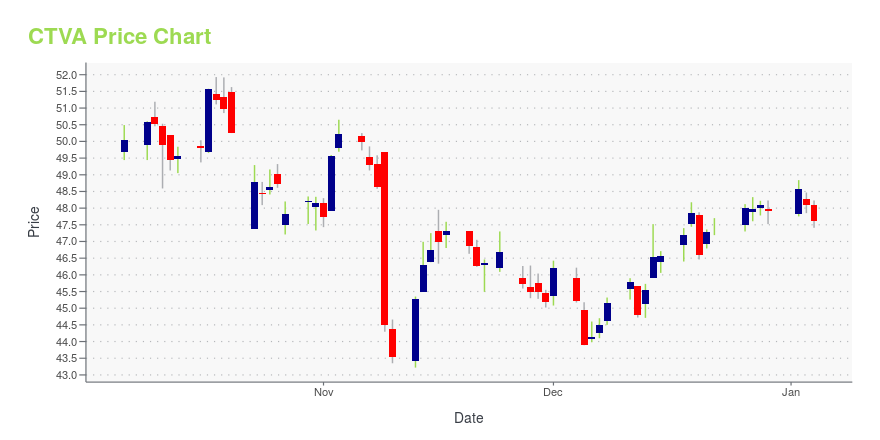
| Current price | $55.39 | 52-week high | $58.76 |
| Prev. close | $55.28 | 52-week low | $43.22 |
| Day low | $55.20 | Volume | 2,272,011 |
| Day high | $56.06 | Avg. volume | 3,425,469 |
| 50-day MA | $53.87 | Dividend yield | 1.18% |
| 200-day MA | $51.69 | Market Cap | 38.61B |
CTVA Stock Price Chart Interactive Chart >
Corteva Inc. (CTVA) Company Bio
Corteva, Inc. (also known as Corteva Agriscience) is a major American agricultural chemical and seed company that was the agricultural unit of DowDuPont prior to being spun off as an independent public company. (Source:Wikipedia)
Latest CTVA News From Around the Web
Below are the latest news stories about CORTEVA INC that investors may wish to consider to help them evaluate CTVA as an investment opportunity.
Agriculture Advancements: 3 Stocks Cultivating Growth in Agri-TechAgricultural technology is growing rapidly and becoming a big business. |
Chemours (CC), DuPont & Corteva Back U.S. Water System DealChemours (CC), DuPont & Corteva do not intend to exercise the opt-out option and extend support to PFAS Deal with the U.S. Water System. |
Who Pays to Get Forever Chemicals Out of Drinking Water? It Could Be YouOfficials say settlements with 3M and DuPont won’t cover all of the costs of building new filtration systems. |
Chemours, DuPont, and Corteva Provide Update and Affirm Support for PFAS Settlement with U.S. Water SystemsWILMINGTON, Del., December 22, 2023--Chemours, DuPont, and Corteva Provide Update and Affirm Support for PFAS Settlement with U.S. Water Systems |
Corteva Announces Dates for Fourth Quarter 2023 Earnings Release and WebcastCorteva, Inc. (NYSE: CTVA) today announced it will release its fourth quarter 2023 earnings on Wednesday, January 31, 2024, after the stock market close via press release and its website. The earnings will be presented in a live webcast on Thursday, February 1, 2024, at 9:00 a.m. Eastern Time. |
CTVA Price Returns
| 1-mo | 3.26% |
| 3-mo | 1.15% |
| 6-mo | 21.49% |
| 1-year | 0.89% |
| 3-year | 35.00% |
| 5-year | 108.61% |
| YTD | 16.26% |
| 2023 | -17.51% |
| 2022 | 25.86% |
| 2021 | 23.55% |
| 2020 | 33.49% |
| 2019 | N/A |
CTVA Dividends
| Ex-Dividend Date | Type | Payout Amount | Change | ||||||
|---|---|---|---|---|---|---|---|---|---|
| Loading, please wait... | |||||||||
Loading social stream, please wait...