Cue Biopharma, Inc. (CUE): Price and Financial Metrics
CUE Price/Volume Stats
Current price | $1.90 | 52-week high | $5.12 |
Prev. close | $1.84 | 52-week low | $1.70 |
Day low | $1.85 | Volume | 128,241 |
Day high | $1.94 | Avg. volume | 261,554 |
50-day MA | $2.23 | Dividend yield | N/A |
200-day MA | $2.74 | Market Cap | 85.73M |
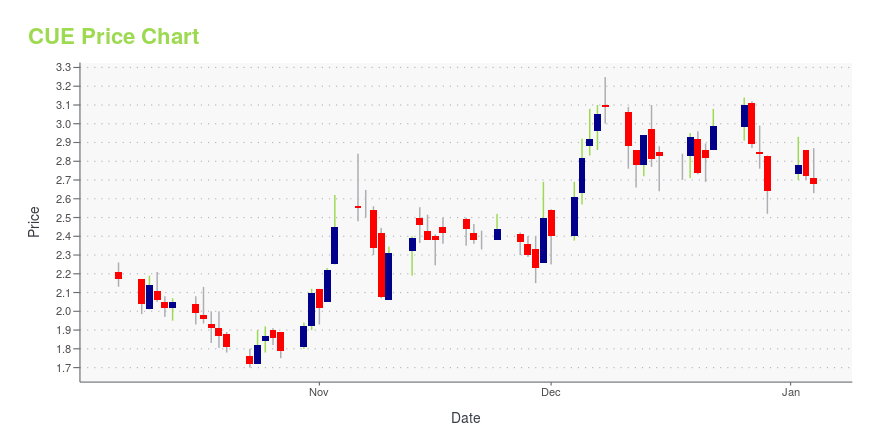
CUE Stock Price Chart Interactive Chart >
CUE POWR Grades
- CUE scores best on the Sentiment dimension, with a Sentiment rank ahead of 74.77% of US stocks.
- The strongest trend for CUE is in Value, which has been heading up over the past 26 weeks.
- CUE ranks lowest in Momentum; there it ranks in the 10th percentile.
CUE Stock Summary
- Of note is the ratio of CUE BIOPHARMA INC's sales and general administrative expense to its total operating expenses; only 11.72% of US stocks have a lower such ratio.
- CUE's price/sales ratio is 32.13; that's higher than the P/S ratio of 95.64% of US stocks.
- Revenue growth over the past 12 months for CUE BIOPHARMA INC comes in at -59.14%, a number that bests merely 3.77% of the US stocks we're tracking.
- Stocks with similar financial metrics, market capitalization, and price volatility to CUE BIOPHARMA INC are AEVA, FATE, CCCC, MRUS, and BOLT.
- Visit CUE's SEC page to see the company's official filings. To visit the company's web site, go to www.cuebiopharma.com.
CUE Valuation Summary
- CUE's price/sales ratio is 31.2; this is 642.86% higher than that of the median Healthcare stock.
- CUE's EV/EBIT ratio has moved up 21.8 over the prior 73 months.
Below are key valuation metrics over time for CUE.
Stock | Date | P/S | P/B | P/E | EV/EBIT |
---|---|---|---|---|---|
CUE | 2023-12-29 | 31.2 | 2.8 | -2.3 | -1.5 |
CUE | 2023-12-28 | 33.6 | 3.0 | -2.5 | -1.7 |
CUE | 2023-12-27 | 34.1 | 3.1 | -2.5 | -1.8 |
CUE | 2023-12-26 | 36.6 | 3.3 | -2.7 | -1.9 |
CUE | 2023-12-22 | 35.3 | 3.2 | -2.6 | -1.8 |
CUE | 2023-12-21 | 33.3 | 3.0 | -2.5 | -1.7 |
CUE Growth Metrics
- Its 5 year net income to common stockholders growth rate is now at -64.62%.
- The year over year net income to common stockholders growth rate now stands at -3.24%.
- The 5 year price growth rate now stands at 88.61%.
The table below shows CUE's growth in key financial areas (numbers in millions of US dollars).
Date | Revenue | Operating Cash Flow | Net Income to Common Stock |
---|---|---|---|
2022-09-30 | 9.34837 | -41.93717 | -46.80217 |
2022-06-30 | 11.67537 | -41.69317 | -48.84018 |
2022-03-31 | 14.38837 | -38.61517 | -45.91118 |
2021-12-31 | 14.94137 | -38.83717 | -44.16118 |
2021-09-30 | 7.162325 | -35.19103 | -46.87992 |
2021-06-30 | 5.471325 | -36.25103 | -43.91792 |
CUE's Quality Factors
The “Quality” component of the POWR Ratings focuses on 31 different factors of a companies fundamentals and operational strength. Here are some key insights as we drill into the specifics of these quality attributes.- CUE has a Quality Grade of D, ranking ahead of 17% of graded US stocks.
- CUE's asset turnover comes in at 0.057 -- ranking 313th of 682 Pharmaceutical Products stocks.
- 500 - Internal server error
The table below shows CUE's key quality metrics over time.
Period | Asset Turnover | Gross Margin | ROIC |
---|---|---|---|
2021-06-30 | 0.057 | 1 | -4.121 |
2021-03-31 | 0.038 | 1 | -2.398 |
2020-12-31 | 0.034 | 1 | -1.802 |
2020-09-30 | 0.044 | 1 | -1.622 |
2020-06-30 | 0.058 | 1 | -1.826 |
2020-03-31 | 0.073 | 1 | -2.258 |
CUE Price Target
For more insight on analysts targets of CUE, see our CUE price target page. And for a list of of all stocks sorted by upside potential based on analyst target price, see our Top Price Target page.
Average Price Target | $29.83 | Average Broker Recommendation | 1.2 (Strong Buy) |
Cue Biopharma, Inc. (CUE) Company Bio
Cue Biopharma, Inc., a preclinical stage biopharmaceutical company, develops biologic drugs for the selective modulation of the human immune system to treat various cancers and autoimmune disorders. Its lead drug candidate comprises CUE-101, a variant form of the cytokine Interleukin-2 and a T cell antigen to target and activate T cells specific to HPV-related cancers. The company’s biologics drug candidates also include CUE-100 series to improve various tumor specific T cells; and CUE-200 series to reinvigorate exhausted T cells. It also offers MOD costimulatory optimization and discovery platform and viraTope T cell epitope discovery platform to develop novel biologics for addressing new indications in oncology and autoimmune disorders. The company was formerly known as Imagen Biopharma, Inc. and changed its name to Cue Biopharma, Inc. in October 2016. Cue Biopharma, Inc. was founded in 2014 and is based in Cambridge, Massachusetts.
Latest CUE News From Around the Web
Below are the latest news stories about CUE BIOPHARMA INC that investors may wish to consider to help them evaluate CUE as an investment opportunity.
CUE Stock Earnings: Cue Biopharma Beats EPS, Beats Revenue for Q3 2023CUE stock results show that Cue Biopharma beat analyst estimates for earnings per share and beat on revenue for the third quarter of 2023. |
Are Medical Stocks Lagging Corvus Pharmaceuticals (CRVS) This Year?Here is how Corvus Pharmaceuticals (CRVS) and Cue Biopharma, Inc. (CUE) have performed compared to their sector so far this year. |
Cue Biopharma to Present at the JMP Securities Hematology and Oncology SummitBOSTON, Nov. 22, 2023 (GLOBE NEWSWIRE) -- Cue Biopharma, Inc. (Nasdaq: CUE), a clinical-stage biopharmaceutical company developing a novel class of T cell engagers to selectively modulate tumor-specific T cells, announced today that it will take part in a fireside chat at the JMP Securities Hematology and Oncology Summit being held virtually from December 5-6, 2023. During the fireside chat, Cue Biopharma will discuss recent data highlights from its lead clinical programs, CUE-101 and CUE-102, r |
Cue Biopharma, Inc. (NASDAQ:CUE) Q3 2023 Earnings Call TranscriptCue Biopharma, Inc. (NASDAQ:CUE) Q3 2023 Earnings Call Transcript November 11, 2023 Operator: Good afternoon, ladies and gentlemen, and welcome to the Cue Biopharma Third Quarter 2023 Earnings Call. At this time, all lines are in listen-only mode. Following the presentation, we will conduct a question-and-answer session. [Operator Instructions] As a reminder, this call is […] |
Cue Biopharma Reports Third Quarter 2023 Financial Results and Recent Business HighlightsBOSTON, Nov. 09, 2023 (GLOBE NEWSWIRE) -- Cue Biopharma, Inc. (Nasdaq: CUE), a clinical-stage biopharmaceutical company developing a novel class of T cell engagers to selectively modulate tumor-specific T cells, provided a business and financial update for the third quarter of 2023. Recent Business Highlights Presented positive data from ongoing Phase 1 trials of CUE-101 and CUE-102 at the Society for Immunotherapy of Cancer’s 38th Anniversary Annual Meeting (SITC 2023) held November 1-5. Update |
CUE Price Returns
1-mo | -19.49% |
3-mo | -28.03% |
6-mo | -17.39% |
1-year | -45.17% |
3-year | -83.04% |
5-year | -75.42% |
YTD | -28.03% |
2023 | -7.37% |
2022 | -74.80% |
2021 | -9.59% |
2020 | -21.20% |
2019 | 237.77% |
Continue Researching CUE
Here are a few links from around the web to help you further your research on Cue Biopharma Inc's stock as an investment opportunity:Cue Biopharma Inc (CUE) Stock Price | Nasdaq
Cue Biopharma Inc (CUE) Stock Quote, History and News - Yahoo Finance
Cue Biopharma Inc (CUE) Stock Price and Basic Information | MarketWatch
Loading social stream, please wait...