Cavco Industries, Inc. (CVCO): Price and Financial Metrics
GET POWR RATINGS... FREE!
CVCO POWR Grades
- CVCO scores best on the Sentiment dimension, with a Sentiment rank ahead of 96.78% of US stocks.
- The strongest trend for CVCO is in Growth, which has been heading down over the past 177 days.
- CVCO's current lowest rank is in the Stability metric (where it is better than 27.78% of US stocks).
CVCO Stock Summary
- Of note is the ratio of CAVCO INDUSTRIES INC's sales and general administrative expense to its total operating expenses; 86.95% of US stocks have a lower such ratio.
- For CVCO, its debt to operating expenses ratio is greater than that reported by just 10.86% of US equities we're observing.
- With a year-over-year growth in debt of -46.28%, CAVCO INDUSTRIES INC's debt growth rate surpasses just 6.1% of about US stocks.
- Stocks with similar financial metrics, market capitalization, and price volatility to CAVCO INDUSTRIES INC are EBF, KRT, STRT, VPG, and URBN.
- CVCO's SEC filings can be seen here. And to visit CAVCO INDUSTRIES INC's official web site, go to www.cavco.com.
CVCO Valuation Summary
- In comparison to the median Consumer Cyclical stock, CVCO's price/sales ratio is 45.45% lower, now standing at 1.2.
- CVCO's EV/EBIT ratio has moved up 21.5 over the prior 239 months.
Below are key valuation metrics over time for CVCO.
Stock | Date | P/S | P/B | P/E | EV/EBIT |
---|---|---|---|---|---|
CVCO | 2023-02-02 | 1.2 | 2.7 | 9.3 | 7.1 |
CVCO | 2023-02-01 | 1.2 | 2.6 | 9.2 | 7.1 |
CVCO | 2023-01-31 | 1.1 | 2.6 | 8.9 | 6.8 |
CVCO | 2023-01-30 | 1.1 | 2.5 | 8.7 | 6.6 |
CVCO | 2023-01-27 | 1.1 | 2.6 | 9.0 | 6.9 |
CVCO | 2023-01-26 | 1.1 | 2.6 | 8.9 | 6.8 |
CVCO Growth Metrics
- Its 3 year net cashflow from operations growth rate is now at 339.23%.
- Its 5 year net income to common stockholders growth rate is now at 97.78%.
- Its 2 year price growth rate is now at 8.38%.

The table below shows CVCO's growth in key financial areas (numbers in millions of US dollars).
Date | Revenue | Operating Cash Flow | Net Income to Common Stock |
---|---|---|---|
2022-09-30 | 2,102.923 | 227.079 | 266.761 |
2022-06-30 | 1,885.074 | 178.189 | 230.255 |
2022-03-31 | 1,627.158 | 144.224 | 197.699 |
2021-12-31 | 1,428.181 | 148.432 | 169.297 |
2021-09-30 | 1,285.239 | 119.509 | 109.579 |
2021-06-30 | 1,183.672 | 102.614 | 87.018 |
CVCO's Quality Factors
The “Quality” component of the POWR Ratings focuses on 31 different factors of a companies fundamentals and operational strength. Here are some key insights as we drill into the specifics of these quality attributes.- CVCO has a Quality Grade of C, ranking ahead of 70.09% of graded US stocks.
- CVCO's asset turnover comes in at 1.276 -- ranking 9th of 60 Construction Materials stocks.
- OFLX, RUN, and PRLB are the stocks whose asset turnover ratios are most correlated with CVCO.
The table below shows CVCO's key quality metrics over time.
Period | Asset Turnover | Gross Margin | ROIC |
---|---|---|---|
2021-07-03 | 1.276 | 0.218 | 0.371 |
2021-04-03 | 1.238 | 0.216 | 0.327 |
2020-12-26 | 1.230 | 0.208 | 0.272 |
2020-09-26 | 1.256 | 0.212 | 0.260 |
2020-06-27 | 1.312 | 0.214 | 0.275 |
2020-03-28 | 1.358 | 0.217 | 0.289 |
CVCO Price Target
For more insight on analysts targets of CVCO, see our CVCO price target page. And for a list of of all stocks sorted by upside potential based on analyst target price, see our Top Price Target page.
Average Price Target | $278.33 | Average Broker Recommendation | 1.67 (Moderate Buy) |
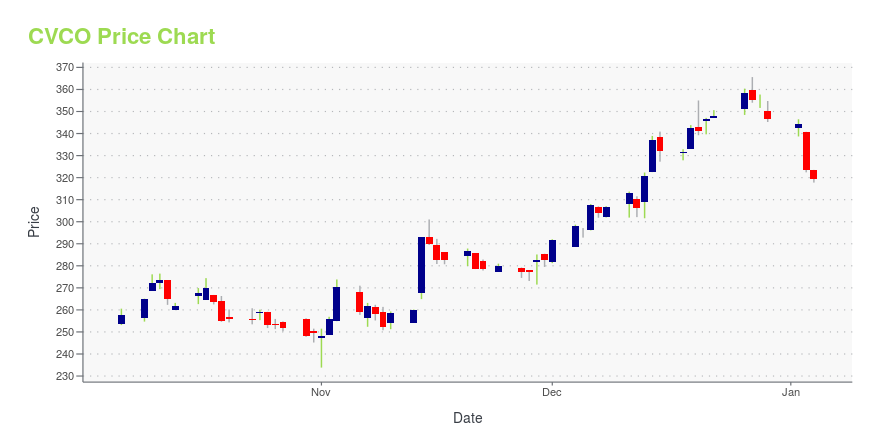
CVCO Stock Price Chart Interactive Chart >
CVCO Price/Volume Stats
Current price | $284.70 | 52-week high | $305.21 |
Prev. close | $269.65 | 52-week low | $179.47 |
Day low | $265.52 | Volume | 61,386 |
Day high | $286.00 | Avg. volume | 74,145 |
50-day MA | $244.44 | Dividend yield | N/A |
200-day MA | $230.37 | Market Cap | 2.54B |
Cavco Industries, Inc. (CVCO) Company Bio
Cavco Industries Inc. engages in the design, production, wholesale, and retail sale of manufactured homes in the United States under the Cavco Homes, Fleetwood Homes, Palm Harbor Homes, Fairmont Homes, and Chariot Eagle brands. It operates through two segments, Factory-Built Housing and Financial Services. The company markets its manufactured homes. The company was founded in 1965 and is based in Phoenix, Arizona.
Latest CVCO News From Around the Web
Below are the latest news stories about CAVCO INDUSTRIES INC that investors may wish to consider to help them evaluate CVCO as an investment opportunity.
Cavco Industries Third Quarter 2023 Earnings: EPS Beats Expectations, Revenues LagCavco Industries ( NASDAQ:CVCO ) Third Quarter 2023 Results Key Financial Results Revenue: US$500.6m (up 16% from 3Q... |
Cavco (CVCO) Q3 Earnings Beat EstimatesCavco (CVCO) delivered earnings and revenue surprises of 13.85% and 7.33%, respectively, for the quarter ended December 2022. Do the numbers hold clues to what lies ahead for the stock? |
Cavco Industries Reports Fiscal 2023 Third Quarter Results and Provides Business UpdatesPHOENIX, Feb. 02, 2023 (GLOBE NEWSWIRE) -- Cavco Industries, Inc. (Nasdaq: CVCO) ("we," "our," the "Company" or "Cavco") today announced financial results for the third fiscal quarter ended December 31, 2022 and provided updates on other business items. Third Quarter Highlights Net revenue increased to $501 million, or 16.0%, compared to $432 million in the third quarter of the prior year.Income before income taxes increased to $76 million, or 29%, compared to $59 million in the prior year perio |
Webcast Alert: Cavco Industries, Inc. Announces Fiscal 2023 Third Quarter Earnings Release and Conference Call WebcastPHOENIX, Jan. 25, 2023 (GLOBE NEWSWIRE) -- Cavco Industries, Inc. (Nasdaq: CVCO) will release earnings for the third quarter ended December 31, 2022 on Thursday, February 2, 2023 after the close of market. Senior management will discuss the results in a live webcast the following day, Friday, February 3, 2023 at 1:00 p.m. Eastern Time. Date: February 3, 2023 Time: 1:00 p.m. ET Listen via Internet: https://investor.cavco.com/ Listen via Telephone: To participate in the call, please register here |
An Intrinsic Calculation For Cavco Industries, Inc. (NASDAQ:CVCO) Suggests It's 25% UndervaluedDoes the January share price for Cavco Industries, Inc. ( NASDAQ:CVCO ) reflect what it's really worth? Today, we will... |
CVCO Price Returns
1-mo | 21.22% |
3-mo | 34.08% |
6-mo | 2.31% |
1-year | -2.63% |
3-year | 24.45% |
5-year | 78.27% |
YTD | 25.83% |
2022 | -28.77% |
2021 | 81.05% |
2020 | -10.20% |
2019 | 49.85% |
2018 | -14.56% |
Continue Researching CVCO
Here are a few links from around the web to help you further your research on Cavco Industries Inc's stock as an investment opportunity:Cavco Industries Inc (CVCO) Stock Price | Nasdaq
Cavco Industries Inc (CVCO) Stock Quote, History and News - Yahoo Finance
Cavco Industries Inc (CVCO) Stock Price and Basic Information | MarketWatch
Loading social stream, please wait...