
Cenovus Energy Inc. (CVE): Price and Financial Metrics
CVE Price/Volume Stats
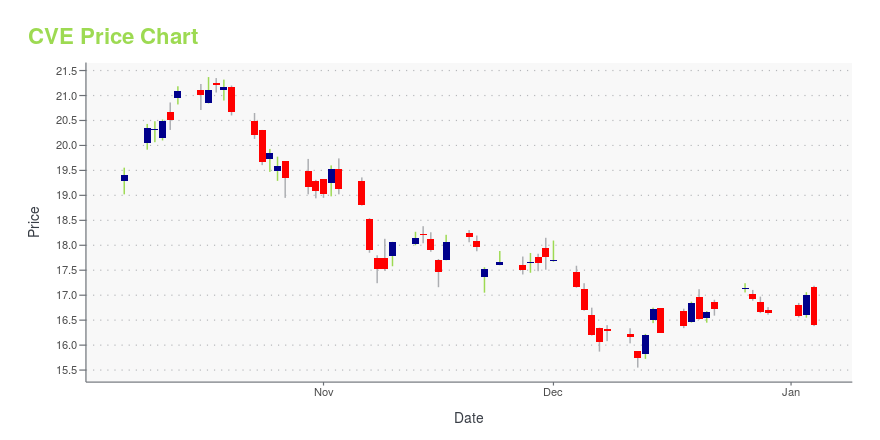
| Current price | $14.31 | 52-week high | $20.40 |
| Prev. close | $14.05 | 52-week low | $10.23 |
| Day low | $13.99 | Volume | 10,040,200 |
| Day high | $14.32 | Avg. volume | 11,768,056 |
| 50-day MA | $13.91 | Dividend yield | 4.14% |
| 200-day MA | $0.00 | Market Cap | 25.89B |
CVE Stock Price Chart Interactive Chart >
CVE Price Returns
| 1-mo | 2.80% |
| 3-mo | 19.38% |
| 6-mo | -1.45% |
| 1-year | -23.78% |
| 3-year | -7.42% |
| 5-year | 215.02% |
| YTD | -3.66% |
| 2024 | -5.83% |
| 2023 | -12.31% |
| 2022 | 60.93% |
| 2021 | 104.10% |
| 2020 | -39.55% |
CVE Dividends
| Ex-Dividend Date | Type | Payout Amount | Change | ||||||
|---|---|---|---|---|---|---|---|---|---|
| Loading, please wait... | |||||||||
Continue Researching CVE
Here are a few links from around the web to help you further your research on Cenovus Energy Inc's stock as an investment opportunity:Cenovus Energy Inc (CVE) Stock Price | Nasdaq
Cenovus Energy Inc (CVE) Stock Quote, History and News - Yahoo Finance
Cenovus Energy Inc (CVE) Stock Price and Basic Information | MarketWatch
Loading social stream, please wait...