
Cenovus Energy Inc. (CVE): Price and Financial Metrics
CVE Price/Volume Stats
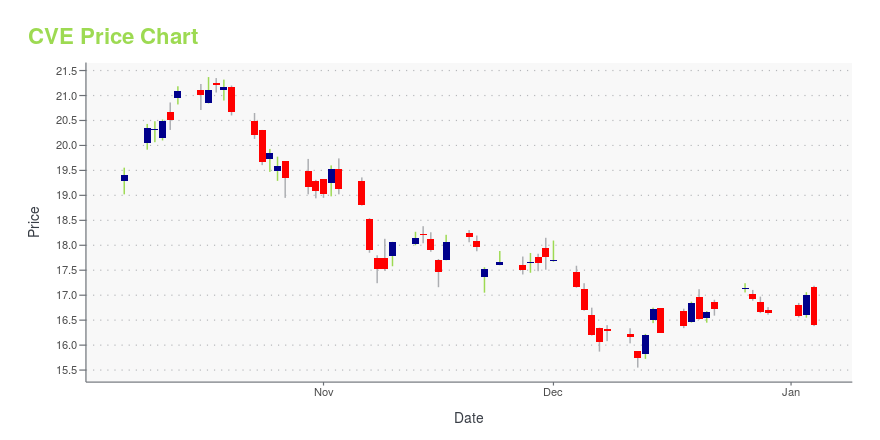
| Current price | $19.76 | 52-week high | $21.90 |
| Prev. close | $19.76 | 52-week low | $14.69 |
| Day low | $19.39 | Volume | 4,817,105 |
| Day high | $19.86 | Avg. volume | 9,308,942 |
| 50-day MA | $19.68 | Dividend yield | 2.71% |
| 200-day MA | $18.65 | Market Cap | 36.74B |
CVE Stock Price Chart Interactive Chart >
Latest CVE News From Around the Web
Below are the latest news stories about CENOVUS ENERGY INC that investors may wish to consider to help them evaluate CVE as an investment opportunity.
Oil & Gas Stock Roundup: Exxon's Hebron Approval & Shell's Sparta FID Stand OutXOM, SHEL, EQNR, CVE and IMO emerge as the energy headline makers during the week. |
Cenovus (CVE) Creates Kaybob Duvernay JV With AthabascaTo kickstart the creation of Duvernay Energy, Cenovus (CVE) will contribute $18 million and Athabasca will contribute $22 million in seed capital. |
13 Most Promising Energy Stocks According to AnalystsIn this article, we discuss the 13 most promising energy stocks according to analysts. To skip the overview of the energy sector, go directly to the 5 Most Promising Energy Stocks According to Analysts. Despite the global push toward clean energy, fossil fuels have shown their impact on the economy in recent years. While renewable […] |
12 Most Profitable Canadian StocksIn this piece, we will take a look at the 12 most profitable Canadian stocks. If you want to skip our overview of the Canadian economy, then you can take a look at the 5 Most Profitable Canadian Stocks. Canada is one of the most prosperous nations in the world. The Canadian economy is worth […] |
Cenovus Energy forecasts higher US refinery output in 2024The company had been grappling with production snags following a deadly fire at its refinery in Toledo, Ohio last year and an explosion at the refinery in Superior, Wisconsin in 2018. Cenovus also expects higher operating costs in 2024 due to maintenance and repair activities. "We will remain focused on reducing costs and continued capital discipline," Cenovus CEO Jon McKenzie said. |
CVE Price Returns
| 1-mo | 2.12% |
| 3-mo | -6.80% |
| 6-mo | 24.15% |
| 1-year | 10.21% |
| 3-year | 162.36% |
| 5-year | 133.90% |
| YTD | 20.79% |
| 2023 | -12.31% |
| 2022 | 60.94% |
| 2021 | 104.10% |
| 2020 | -39.55% |
| 2019 | 46.98% |
CVE Dividends
| Ex-Dividend Date | Type | Payout Amount | Change | ||||||
|---|---|---|---|---|---|---|---|---|---|
| Loading, please wait... | |||||||||
Continue Researching CVE
Here are a few links from around the web to help you further your research on Cenovus Energy Inc's stock as an investment opportunity:Cenovus Energy Inc (CVE) Stock Price | Nasdaq
Cenovus Energy Inc (CVE) Stock Quote, History and News - Yahoo Finance
Cenovus Energy Inc (CVE) Stock Price and Basic Information | MarketWatch
Loading social stream, please wait...