
Carvana Co. (CVNA): Price and Financial Metrics
CVNA Price/Volume Stats
| Current price | $132.85 | 52-week high | $147.25 |
| Prev. close | $124.10 | 52-week low | $25.09 |
| Day low | $127.50 | Volume | 4,200,453 |
| Day high | $136.45 | Avg. volume | 5,473,445 |
| 50-day MA | $118.67 | Dividend yield | N/A |
| 200-day MA | $73.33 | Market Cap | 26.91B |
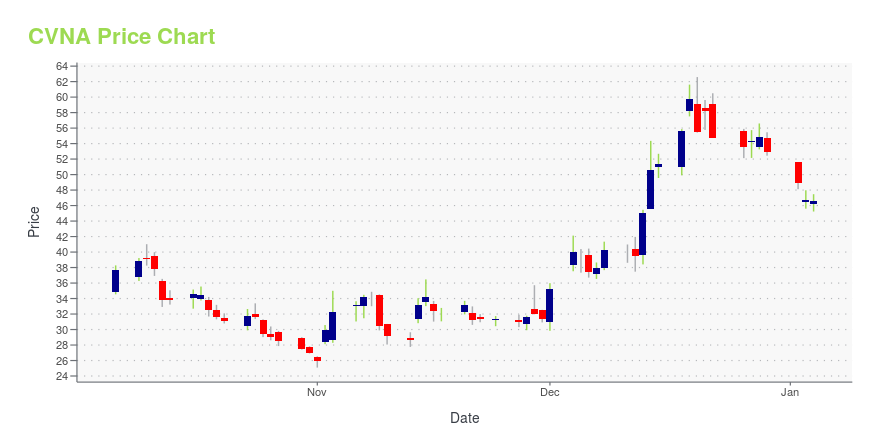
CVNA Stock Price Chart Interactive Chart >
Carvana Co. (CVNA) Company Bio
Carvana sells used cars online. It has distribution centers in Atlanta, Georgia; Nashville, Tennessee; and Charlotte, North Carolina. It also has physical presence in Houston, Austin, Dallas, San Antonio, and Pittsburgh, Texas; and St. Louis, Missouri. Carvana, LLC operates as a subsidiary of DriveTime Automotive Group, Inc. The company was founded in 2012 and is based in Phoenix, Arizona.
Latest CVNA News From Around the Web
Below are the latest news stories about CARVANA CO that investors may wish to consider to help them evaluate CVNA as an investment opportunity.
3 Meme Stocks that Have Nowhere to Go But Down in 2024Various meme stocks are overvalued after rebounding in 2023 and Roundhill's MEME ETF closure offers testimony. |
Smart Shorts: 7 Meme Stocks to Bet Against in 2024These seven meme stocks have surged as speculators declare "the coast is clear," but a big reversal for each of them may be forthcoming. |
The Winners and Losers: 2023 Stock Market Performance ReviewThe 2023 stock market saw steep declines followed by rapid upswings, but we're ending the year on a high note (even if some stocks aren't). |
The Pandemic’s E-Commerce Stars Are CopingOnline retailers that experienced dizzying growth in 2020 and 2021 are settling into their postpandemic reality. |
Carvana and Carrols Were 2 of the Biggest Winners in 2023, Up Over 1,100% and Over 400%, Respectively. Here Are 3 Stocks With Similar Setups for 2024.These stocks might be set up for a big run, but what about the underlying businesses? |
CVNA Price Returns
| 1-mo | 4.94% |
| 3-mo | 57.57% |
| 6-mo | 217.82% |
| 1-year | 228.35% |
| 3-year | -60.58% |
| 5-year | 99.92% |
| YTD | 150.94% |
| 2023 | 1,016.88% |
| 2022 | -97.96% |
| 2021 | -3.24% |
| 2020 | 160.23% |
| 2019 | 181.41% |
Continue Researching CVNA
Here are a few links from around the web to help you further your research on Carvana Co's stock as an investment opportunity:Carvana Co (CVNA) Stock Price | Nasdaq
Carvana Co (CVNA) Stock Quote, History and News - Yahoo Finance
Carvana Co (CVNA) Stock Price and Basic Information | MarketWatch
Loading social stream, please wait...