
Chevron Corporation (CVX): Price and Financial Metrics
CVX Price/Volume Stats
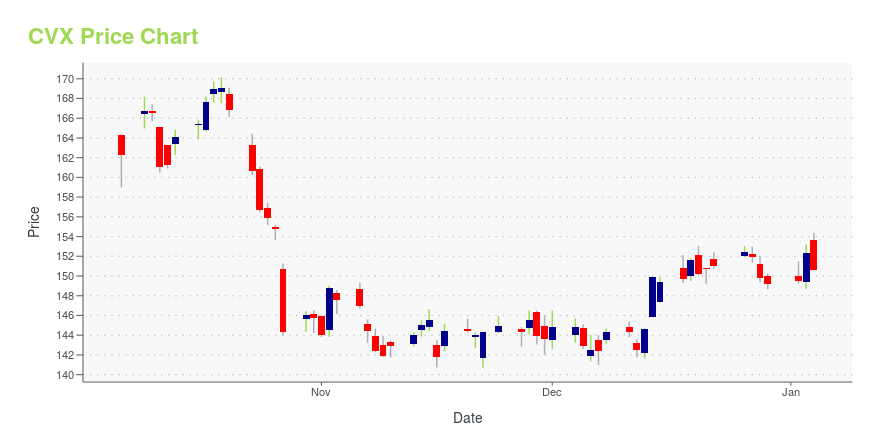
| Current price | $157.84 | 52-week high | $171.70 |
| Prev. close | $157.54 | 52-week low | $139.62 |
| Day low | $157.06 | Volume | 5,232,514 |
| Day high | $159.04 | Avg. volume | 7,806,995 |
| 50-day MA | $157.05 | Dividend yield | 4.23% |
| 200-day MA | $153.84 | Market Cap | 290.89B |
CVX Stock Price Chart Interactive Chart >
Chevron Corporation (CVX) Company Bio
Chevron engages in the petroleum, chemicals, and power and energy operations worldwide. The company operates in two segments, Upstream and Downstream. The company was founded in 1879 and is based in San Ramon, California.
Latest CVX News From Around the Web
Below are the latest news stories about CHEVRON CORP that investors may wish to consider to help them evaluate CVX as an investment opportunity.
Disaster-Proof Dividends: 3 Stocks with Resilient Payouts in Tough TimesEnjoy steady passive income and capital growth in your portfolio through these three dividend stocks with steady payouts. |
3 Energy Stocks You’ll Regret Not Buying SoonDiscover 2024's top energy stocks: Exxon Mobil, Chevron, EQT. |
Down 16% in 2023, This Dow Jones Stock Could Stage an Epic Recovery in 2024Chevron has value and income written all over it. |
The 7 Highest-Yielding Dividend Gems in Warren Buffet’s CrownWarren Buffett doesn’t hide the fact he loves dividends. |
Down in 2023, Are XOM & CVX Poised for a Turnaround in 2024?In 2024, ExxonMobil (XOM) & Chevron (CVX) are anticipated to experience a smoother trajectory, thanks to their commanding upstream operations and robust balance sheets. |
CVX Price Returns
| 1-mo | 1.21% |
| 3-mo | -3.89% |
| 6-mo | 8.07% |
| 1-year | 2.99% |
| 3-year | 76.83% |
| 5-year | 59.14% |
| YTD | 8.05% |
| 2023 | -13.63% |
| 2022 | 58.46% |
| 2021 | 46.24% |
| 2020 | -25.95% |
| 2019 | 15.27% |
CVX Dividends
| Ex-Dividend Date | Type | Payout Amount | Change | ||||||
|---|---|---|---|---|---|---|---|---|---|
| Loading, please wait... | |||||||||
Continue Researching CVX
Here are a few links from around the web to help you further your research on Chevron Corp's stock as an investment opportunity:Chevron Corp (CVX) Stock Price | Nasdaq
Chevron Corp (CVX) Stock Quote, History and News - Yahoo Finance
Chevron Corp (CVX) Stock Price and Basic Information | MarketWatch
Loading social stream, please wait...