Clearway Energy Inc. Cl C (CWEN): Price and Financial Metrics
GET POWR RATINGS... FREE!
CWEN POWR Grades
- Momentum is the dimension where CWEN ranks best; there it ranks ahead of 87.07% of US stocks.
- The strongest trend for CWEN is in Growth, which has been heading down over the past 179 days.
- CWEN ranks lowest in Growth; there it ranks in the 2nd percentile.
CWEN Stock Summary
- Of note is the ratio of CLEARWAY ENERGY INC's sales and general administrative expense to its total operating expenses; just 3.15% of US stocks have a lower such ratio.
- The ratio of debt to operating expenses for CLEARWAY ENERGY INC is higher than it is for about 94.67% of US stocks.
- Shareholder yield, a measure of how much is returned to shareholders via dividends and share repurchases, for CWEN comes in at 21.27% -- higher than that of 93.3% of stocks in our set.
- Stocks with similar financial metrics, market capitalization, and price volatility to CLEARWAY ENERGY INC are NJR, LNT, CNP, CMS, and TRTN.
- CWEN's SEC filings can be seen here. And to visit CLEARWAY ENERGY INC's official web site, go to investor.clearwayenergy.com.
CWEN Valuation Summary
- In comparison to the median Utilities stock, CWEN's price/sales ratio is 111.54% higher, now standing at 5.5.
- Over the past 116 months, CWEN's price/sales ratio has gone down 4.7.
Below are key valuation metrics over time for CWEN.
Stock | Date | P/S | P/B | P/E | EV/EBIT |
---|---|---|---|---|---|
CWEN | 2023-01-27 | 5.5 | 3.0 | 12.1 | 13.0 |
CWEN | 2023-01-26 | 5.5 | 3.0 | 12.0 | 12.9 |
CWEN | 2023-01-25 | 5.4 | 2.9 | 11.9 | 12.9 |
CWEN | 2023-01-24 | 5.5 | 3.0 | 12.0 | 12.9 |
CWEN | 2023-01-23 | 5.4 | 2.9 | 11.9 | 12.9 |
CWEN | 2023-01-20 | 5.4 | 2.9 | 11.9 | 12.9 |
CWEN Growth Metrics
- The 4 year price growth rate now stands at 18.15%.
- The 2 year cash and equivalents growth rate now stands at 22.63%.
- The 5 year cash and equivalents growth rate now stands at 19.12%.

The table below shows CWEN's growth in key financial areas (numbers in millions of US dollars).
Date | Revenue | Operating Cash Flow | Net Income to Common Stock |
---|---|---|---|
2022-09-30 | 1,240 | 779 | 562 |
2022-06-30 | 1,251 | 739 | 551 |
2022-03-31 | 1,263 | 747 | 16 |
2021-12-31 | 1,286 | 701 | 51 |
2021-09-30 | 1,248 | 633 | 34 |
2021-06-30 | 1,229 | 602 | 45 |
CWEN's Quality Factors
The “Quality” component of the POWR Ratings focuses on 31 different factors of a companies fundamentals and operational strength. Here are some key insights as we drill into the specifics of these quality attributes.- CWEN has a Quality Grade of C, ranking ahead of 74.39% of graded US stocks.
- CWEN's asset turnover comes in at 0.108 -- ranking 96th of 105 Utilities stocks.
- VIA, D, and OGS are the stocks whose asset turnover ratios are most correlated with CWEN.
The table below shows CWEN's key quality metrics over time.
Period | Asset Turnover | Gross Margin | ROIC |
---|---|---|---|
2021-09-30 | 0.108 | 0.659 | 0.019 |
2021-06-30 | 0.112 | 0.672 | 0.021 |
2021-03-31 | 0.112 | 0.675 | 0.023 |
2020-12-31 | 0.121 | 0.695 | 0.031 |
2020-09-30 | 0.119 | 0.681 | 0.035 |
2020-06-30 | 0.118 | 0.679 | 0.037 |
CWEN Stock Price Chart Interactive Chart >
CWEN Price/Volume Stats
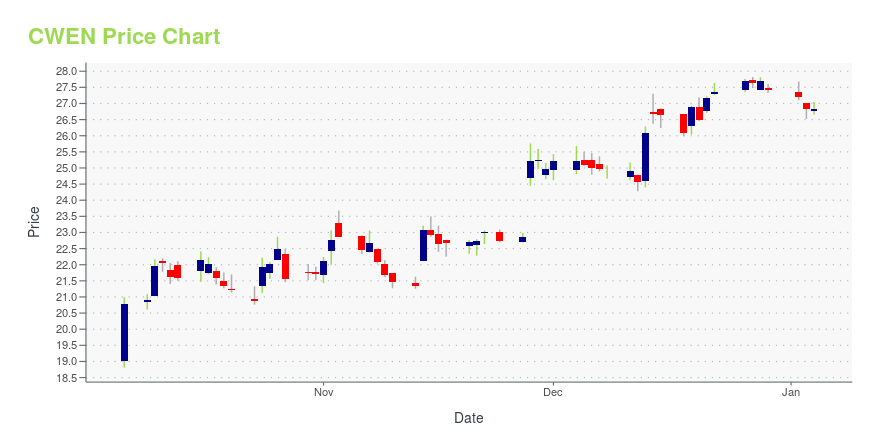
Current price | $33.81 | 52-week high | $41.79 |
Prev. close | $33.79 | 52-week low | $29.61 |
Day low | $33.10 | Volume | 602,600 |
Day high | $34.12 | Avg. volume | 587,062 |
50-day MA | $33.55 | Dividend yield | 4.35% |
200-day MA | $34.57 | Market Cap | 6.83B |
Clearway Energy Inc. Cl C (CWEN) Company Bio
Clearway Energy (formerly NRG Yield, Inc.) acquires, owns, and operates contracted renewable and conventional generation, and thermal infrastructure assets in the United States. The company was founded in 2012 and is based in Princeton, New Jersey. NRG Yield, Inc. is a subsidiary of NRG Energy, Inc.
Latest CWEN News From Around the Web
Below are the latest news stories about CLEARWAY ENERGY INC that investors may wish to consider to help them evaluate CWEN as an investment opportunity.
7 Renewable Energy Stocks That Will Be Big Winners in 2023With green solutions not only great for the planet but also for your wallet, these are the renewable energy stocks to consider. |
CWEN or ORA: Which Is the Better Value Stock Right Now?CWEN vs. ORA: Which Stock Is the Better Value Option? |
Clearway Energy (CWEN) Stock Sinks As Market Gains: What You Should KnowClearway Energy (CWEN) closed the most recent trading day at $33.26, moving -1.1% from the previous trading session. |
7 Top-Rated Utility Stocks to Warm Up Your PortfolioUtilities stocks are resistant to recessionary pressures because earnings stay consistent, regardless of how the economy is performing. |
Clearway Energy (CWEN) Outpaces Stock Market Gains: What You Should KnowClearway Energy (CWEN) closed at $34.53 in the latest trading session, marking a +1.17% move from the prior day. |
CWEN Price Returns
1-mo | 5.56% |
3-mo | -4.41% |
6-mo | -7.39% |
1-year | 6.24% |
3-year | 78.31% |
5-year | 134.09% |
YTD | 6.09% |
2022 | -7.89% |
2021 | 17.83% |
2020 | 67.04% |
2019 | 21.37% |
2018 | -2.11% |
CWEN Dividends
Ex-Dividend Date | Type | Payout Amount | Change | ||||||
---|---|---|---|---|---|---|---|---|---|
Loading, please wait... |
Continue Researching CWEN
Here are a few links from around the web to help you further your research on Clearway Energy Inc's stock as an investment opportunity:Clearway Energy Inc (CWEN) Stock Price | Nasdaq
Clearway Energy Inc (CWEN) Stock Quote, History and News - Yahoo Finance
Clearway Energy Inc (CWEN) Stock Price and Basic Information | MarketWatch
Loading social stream, please wait...