
Cushman & Wakefield PLC (CWK): Price and Financial Metrics
CWK Price/Volume Stats
| Current price | $13.54 | 52-week high | $13.64 |
| Prev. close | $13.17 | 52-week low | $6.24 |
| Day low | $13.29 | Volume | 1,456,325 |
| Day high | $13.64 | Avg. volume | 2,308,085 |
| 50-day MA | $11.13 | Dividend yield | N/A |
| 200-day MA | $9.88 | Market Cap | 3.10B |
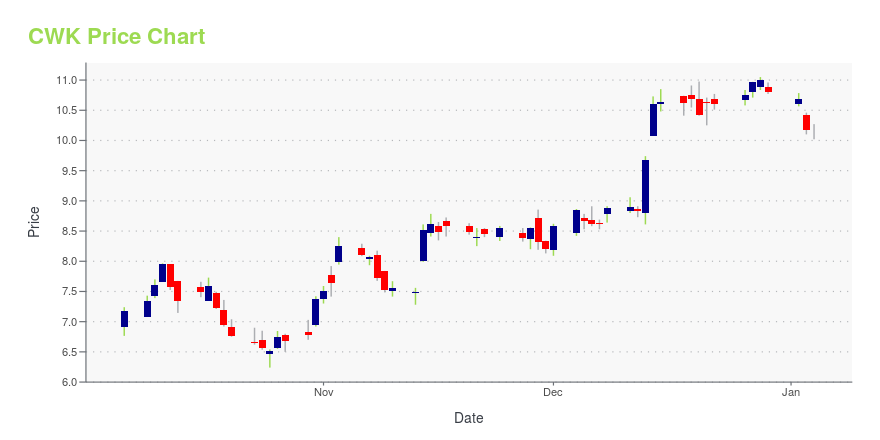
CWK Stock Price Chart Interactive Chart >
Cushman & Wakefield PLC (CWK) Company Bio
Cushman & Wakefield Plc engages in the provision of commercial real estate services It operates through the following geographical segments: Americas; Europe, the Middle East and Africa (EMEA); and Asia Pacific (APAC). The Americas segment consists of operations located in the United States, Canada and key markets in Latin America. The EMEA segment includes operations in the UK, France, Netherlands and other markets in Europe and the Middle East. The APAC segment comprises of operations in Australia, Singapore, China and other markets in the Asia Pacific region. The company was founded in 1917 is headquartered in London, the United Kingdom.
Latest CWK News From Around the Web
Below are the latest news stories about CUSHMAN & WAKEFIELD PLC that investors may wish to consider to help them evaluate CWK as an investment opportunity.
The Title of ‘World’s Priciest Retail Rent’ Resides in AmericaNew York City’s Fifth Avenue is the champion address, as Swarovski, Tiffany and other stores help pull in big crowds after a pandemic slump. |
Cushman & Wakefield Names Rob Rubano Head of Equity Debt Structured Financing for the AmericasLOS ANGELES, December 19, 2023--Cushman & Wakefield has appointed Executive Vice Chair Rob Rubano as the firm’s Head of Equity, Debt & Structured Finance (EDSF) for the Americas. |
Cushman & Wakefield Promotes Rob Rubano to EDSF HeadRob Rubano, who joined Cushman & Wakefield (CWK) from Eastdil Secured five years ago and has since become one of the brokerage’s top 100 producers, has been elevated as the firm’s head of equity, debt and structured finance (EDSF) for the Americas, Commercial Observer can first report. Rubano, who is based in Los Angeles, completed more than 60 financings in 2022 with a loan volume of $8.5 billion, according to C&W. During his nearly 20-year career, Rubano has executed more than $80 billion in transaction volume. “Rob is a demonstrated leader in the capital markets space and has extensive experience working in various parts of the capital stack, including first mortgages, B notes, mezzanine financings and preferred equity,” Dan Broderick, president of C&W’s Americas advisory, said in ... |
Cushman & Wakefield Unveils Asset Optimization Group for Underperforming and Distressed AssetsCHICAGO, December 18, 2023--Cushman & Wakefield announced its Asset Optimization Group to supporting lenders, investors and servicers of underperforming assets. |
Cushman & Wakefield plc's (NYSE:CWK) Shares Lagging The Industry But So Is The BusinessCushman & Wakefield plc's ( NYSE:CWK ) price-to-sales (or "P/S") ratio of 0.3x might make it look like a buy right now... |
CWK Price Returns
| 1-mo | 32.10% |
| 3-mo | 39.30% |
| 6-mo | 31.07% |
| 1-year | 42.38% |
| 3-year | -23.55% |
| 5-year | -31.34% |
| YTD | 25.37% |
| 2023 | -13.32% |
| 2022 | -43.97% |
| 2021 | 49.97% |
| 2020 | -27.45% |
| 2019 | 41.26% |
Continue Researching CWK
Want to do more research on Cushman & Wakefield plc's stock and its price? Try the links below:Cushman & Wakefield plc (CWK) Stock Price | Nasdaq
Cushman & Wakefield plc (CWK) Stock Quote, History and News - Yahoo Finance
Cushman & Wakefield plc (CWK) Stock Price and Basic Information | MarketWatch
Loading social stream, please wait...