Casella Waste Systems, Inc. - (CWST): Price and Financial Metrics
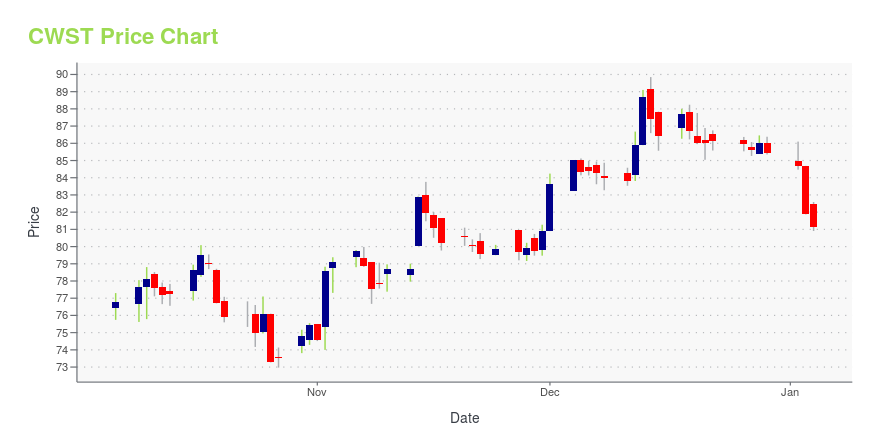
CWST Price/Volume Stats
Current price | $83.62 | 52-week high | $95.78 |
Prev. close | $80.88 | 52-week low | $72.33 |
Day low | $80.90 | Volume | 286,900 |
Day high | $84.24 | Avg. volume | 292,639 |
50-day MA | $77.98 | Dividend yield | N/A |
200-day MA | $82.85 | Market Cap | 4.85B |
CWST Stock Price Chart Interactive Chart >
CWST POWR Grades
- CWST scores best on the Quality dimension, with a Quality rank ahead of 59.93% of US stocks.
- CWST's strongest trending metric is Quality; it's been moving down over the last 177 days.
- CWST ranks lowest in Value; there it ranks in the 8th percentile.
CWST Stock Summary
- With a price/earnings ratio of 2,308.87, CASELLA WASTE SYSTEMS INC P/E ratio is greater than that of about 99.83% of stocks in our set with positive earnings.
- Price to trailing twelve month operating cash flow for CWST is currently 369.4, higher than 99.34% of US stocks with positive operating cash flow.
- With a price/sales ratio of 69.89, CASELLA WASTE SYSTEMS INC has a higher such ratio than 97.44% of stocks in our set.
- If you're looking for stocks that are quantitatively similar to CASELLA WASTE SYSTEMS INC, a group of peers worth examining would be UCTT, MC, ITI, TILE, and MKC.
- CWST's SEC filings can be seen here. And to visit CASELLA WASTE SYSTEMS INC's official web site, go to www.casella.com.
CWST Valuation Summary
- CWST's price/earnings ratio is 2282.8; this is 11429.29% higher than that of the median Industrials stock.
- CWST's price/sales ratio has moved up 68.4 over the prior 243 months.
Below are key valuation metrics over time for CWST.
Stock | Date | P/S | P/B | P/E | EV/EBIT |
---|---|---|---|---|---|
CWST | 2023-11-09 | 69.1 | 78.9 | 2282.8 | 956.4 |
CWST | 2023-11-08 | 68.9 | 78.6 | 2275.1 | 953.2 |
CWST | 2023-11-07 | 70.1 | 80.0 | 2314.4 | 969.5 |
CWST | 2023-11-06 | 70.8 | 80.8 | 2338.5 | 979.5 |
CWST | 2023-11-03 | 70.3 | 80.2 | 2321.2 | 972.3 |
CWST | 2023-11-02 | 69.8 | 79.7 | 2305.1 | 965.6 |
CWST Growth Metrics
- The 4 year net income to common stockholders growth rate now stands at 6328.09%.
- Its 3 year net cashflow from operations growth rate is now at 55.39%.
- Its 2 year price growth rate is now at 68.87%.

The table below shows CWST's growth in key financial areas (numbers in millions of US dollars).
Date | Revenue | Operating Cash Flow | Net Income to Common Stock |
---|---|---|---|
2022-12-31 | 1,085.089 | 217.314 | 53.079 |
2022-09-30 | 1,054.797 | 201.079 | 53.803 |
2022-06-30 | 1,001.498 | 195.975 | 46.992 |
2022-03-31 | 933.707 | 175.304 | 40.979 |
2021-12-31 | 889.211 | 182.737 | 41.1 |
2021-09-30 | 847.616 | 162.096 | 94.872 |
CWST's Quality Factors
The “Quality” component of the POWR Ratings focuses on 31 different factors of a companies fundamentals and operational strength. Here are some key insights as we drill into the specifics of these quality attributes.- CWST has a Quality Grade of B, ranking ahead of 76.7% of graded US stocks.
- CWST's asset turnover comes in at 0.701 -- ranking 7th of 14 Almost Nothing stocks.
- RSG, HCCI, and WM are the stocks whose asset turnover ratios are most correlated with CWST.
The table below shows CWST's key quality metrics over time.
Period | Asset Turnover | Gross Margin | ROIC |
---|---|---|---|
2021-06-30 | 0.701 | 0.345 | 0.056 |
2021-03-31 | 0.718 | 0.342 | 0.053 |
2020-12-31 | 0.753 | 0.334 | 0.050 |
2020-09-30 | 0.798 | 0.332 | 0.051 |
2020-06-30 | 0.806 | 0.327 | 0.050 |
2020-03-31 | 0.826 | 0.319 | 0.050 |
CWST Price Target
For more insight on analysts targets of CWST, see our CWST price target page. And for a list of of all stocks sorted by upside potential based on analyst target price, see our Top Price Target page.
Average Price Target | $76.83 | Average Broker Recommendation | 1.5 (Moderate Buy) |
Casella Waste Systems, Inc. - (CWST) Company Bio
Casella Waste Systems operates as a regional, vertically-integrated solid waste, and resource management services company in the northeastern United States. The company was founded in 1975 and is based in Rutland, Vermont.
Latest CWST News From Around the Web
Below are the latest news stories about CASELLA WASTE SYSTEMS INC that investors may wish to consider to help them evaluate CWST as an investment opportunity.
At US$82.86, Is Casella Waste Systems, Inc. (NASDAQ:CWST) Worth Looking At Closely?While Casella Waste Systems, Inc. ( NASDAQ:CWST ) might not be the most widely known stock at the moment, it saw a... |
Here’s Why Casella Waste Systems (CWST) Declined in Q3Conestoga Capital Advisors, an asset management company, released its “Small Cap Strategy” third-quarter 2023 investor letter. A copy of the same can be downloaded here. The Small Cap Composite returned -6.72% net-of-fees in the third quarter, compared to the Russell 2000 Growth Index’s -7.32% return. The strategy’s outperformance was driven by positive stock selection effects, while sector […] |
7 Earnings Losers to Load Up On Right NowGenerally speaking, earnings losers represent exactly that – companies that failed to deliver against established targets. |
Casella Waste Systems, Inc. (NASDAQ:CWST) Q3 2023 Earnings Call TranscriptCasella Waste Systems, Inc. (NASDAQ:CWST) Q3 2023 Earnings Call Transcript November 3, 2023 Operator: Good day and thank you for standing by. Welcome to the Casella Waste Systems Q3 2023 Earnings Conference Call. At this time, all participants are in listen-only mode. After the speaker’s presentation, there will be a question-and-answer session. [Operator Instructions] Please […] |
What Makes Casella Waste Systems (CWST) an Attractive Investment?The London Company, an investment management company, released “The London Company SMID Cap Strategy” third quarter 2023 investor letter. A copy of the same can be downloaded here. In the third quarter, the fund declined 5.0% (-5.1% net) compared to a 4.8% fall in the Russell 2500 Index. A lack of exposure to the Energy sector […] |
CWST Price Returns
1-mo | 5.67% |
3-mo | 4.06% |
6-mo | -9.39% |
1-year | -3.47% |
3-year | 42.33% |
5-year | N/A |
YTD | 5.43% |
2022 | -7.15% |
2021 | 37.89% |
2020 | 34.59% |
2019 | 61.57% |
2018 | 23.76% |
Continue Researching CWST
Want to see what other sources are saying about Casella Waste Systems Inc's financials and stock price? Try the links below:Casella Waste Systems Inc (CWST) Stock Price | Nasdaq
Casella Waste Systems Inc (CWST) Stock Quote, History and News - Yahoo Finance
Casella Waste Systems Inc (CWST) Stock Price and Basic Information | MarketWatch
Loading social stream, please wait...