
California Water Service Group (CWT): Price and Financial Metrics
CWT Price/Volume Stats
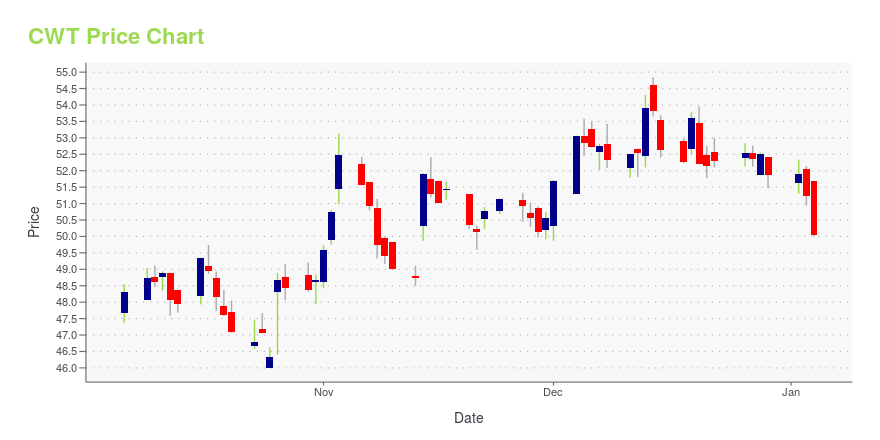
| Current price | $52.92 | 52-week high | $54.85 |
| Prev. close | $52.85 | 52-week low | $43.50 |
| Day low | $52.38 | Volume | 204,197 |
| Day high | $53.33 | Avg. volume | 346,350 |
| 50-day MA | $49.96 | Dividend yield | 2.17% |
| 200-day MA | $48.85 | Market Cap | 3.06B |
CWT Stock Price Chart Interactive Chart >
California Water Service Group (CWT) Company Bio
California Water Services Group provides water utility and other related services in California, Washington, New Mexico, and Hawaii. The company was founded in 1926 and is based in San Jose, California.
Latest CWT News From Around the Web
Below are the latest news stories about CALIFORNIA WATER SERVICE GROUP that investors may wish to consider to help them evaluate CWT as an investment opportunity.
California Water Service Group Shares Key Updates on Climate StrategySAN JOSE, Calif., Dec. 18, 2023 (GLOBE NEWSWIRE) -- California Water Service Group (Group) (NYSE: CWT) today announced key updates for ongoing work to enhance its climate strategy. The company’s Mid-Year Climate Update is published online at www.calwatergroup.com/esg23-update. Additionally, following the announcement of Group’s commitment to set absolute, science-based Scope 1 and Scope 2 GHG emissions reduction targets before the end of the third quarter of 2024, the company confirms that it is |
Investors Interested In California Water Service Group's (NYSE:CWT) EarningsWhen close to half the companies in the United States have price-to-earnings ratios (or "P/E's") below 16x, you may... |
American Water's (AWK) Indiana Arm Invests $97M in UpgradesAmerican Water's (AWK) subsidiary, Indiana American Water, continues to upgrade water mains in its service territories to provide reliable services to its customers. |
American Water (AWK) Arm Buys Donahue City's Assets for $1.75MAmerican Water (AWK), along with its subsidiaries, continues to expand through systematic acquisitions. Regular investments are making its infrastructure more resilient. |
California Water Service Group Earns “America’s Most Responsible Companies” Designation by Newsweek for Third Consecutive YearSAN JOSE, Calif., Dec. 06, 2023 (GLOBE NEWSWIRE) -- For the third year in a row, California Water Service Group (Group) (NYSE: CWT) has earned a spot on Newsweek magazine’s list of “America’s Most Responsible Companies.” Newsweek and Statista Inc., the world’s leading statistics portal and industry ranking provider, recognized Group for the utility’s sustainability and corporate citizenship efforts. Group ranked No. 1 among investor-owned water utilities, 16th in the Energy & Utilities category, |
CWT Price Returns
| 1-mo | 10.39% |
| 3-mo | 11.03% |
| 6-mo | 17.97% |
| 1-year | 6.30% |
| 3-year | -9.06% |
| 5-year | 9.04% |
| YTD | 3.21% |
| 2023 | -12.83% |
| 2022 | -14.13% |
| 2021 | 35.05% |
| 2020 | 6.68% |
| 2019 | 9.85% |
CWT Dividends
| Ex-Dividend Date | Type | Payout Amount | Change | ||||||
|---|---|---|---|---|---|---|---|---|---|
| Loading, please wait... | |||||||||
Continue Researching CWT
Want to see what other sources are saying about California Water Service Group's financials and stock price? Try the links below:California Water Service Group (CWT) Stock Price | Nasdaq
California Water Service Group (CWT) Stock Quote, History and News - Yahoo Finance
California Water Service Group (CWT) Stock Price and Basic Information | MarketWatch
Loading social stream, please wait...