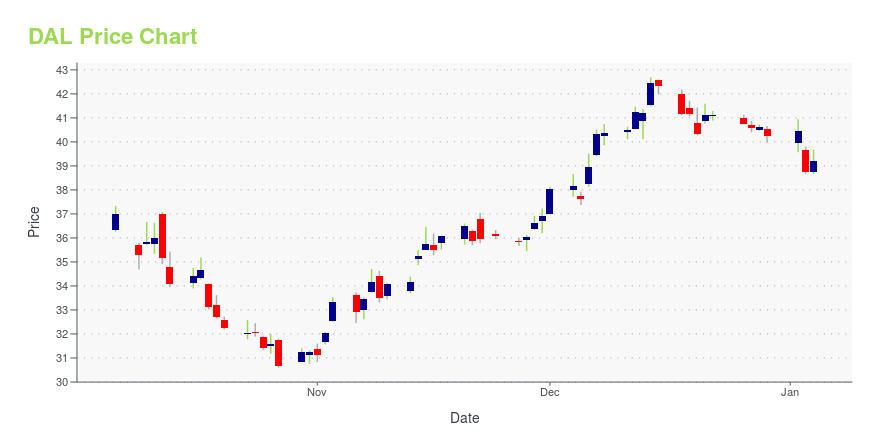
Delta Air Lines Inc. (DAL): Price and Financial Metrics
DAL Price/Volume Stats
| Current price | $44.13 | 52-week high | $53.86 |
| Prev. close | $43.47 | 52-week low | $30.60 |
| Day low | $43.36 | Volume | 8,721,400 |
| Day high | $44.28 | Avg. volume | 9,761,629 |
| 50-day MA | $48.42 | Dividend yield | 0.92% |
| 200-day MA | $42.92 | Market Cap | 28.48B |
DAL Stock Price Chart Interactive Chart >
Delta Air Lines Inc. (DAL) Company Bio
Delta Air Lines, Inc., typically referred to as Delta, is one of the major airlines of the United States and a legacy carrier. One of the world's oldest airlines in operation, Delta is headquartered in Atlanta, Georgia. The airline, along with its subsidiaries and regional affiliates, including Delta Connection, operates over 5,400 flights daily and serves 325 destinations in 52 countries on six continents. Delta is a founding member of the SkyTeam airline alliance. (Source:Wikipedia)
Latest DAL News From Around the Web
Below are the latest news stories about DELTA AIR LINES INC that investors may wish to consider to help them evaluate DAL as an investment opportunity.
7 Megatrend Stocks to Buy for a Mighty Start to 2024Megatrend stocks benefit from exposure to real growth opportunities that have the potential to create massive gains with time. |
Here is why an actress accused Delta of a human rights violationRising to fame through the teenage book-to-Netflix adaption "13 Reasons Why" and later the comedy miniseries "Love in the Time of Corona," trans actress Tommy Dorfman has talked about her experience with Delta Air Lines to her significant social media following in a since-deleted TikTok video. "When you try to advocate for yourself at @delta and are met with even more transphobia and threats of being arrested at LaGuardia," Dorfman, who came out as trans in 2021 and uses she/her pronouns, wrote in the caption to the video. |
Delta Air Lines, Inc. (DAL) is Attracting Investor Attention: Here is What You Should KnowDelta (DAL) has been one of the stocks most watched by Zacks.com users lately. So, it is worth exploring what lies ahead for the stock. |
10 Most Dangerous Airlines In The WorldIn this article, we will take a look at the 10 most dangerous airlines in the world. If you want to skip our discussion on the airline industry, you can go directly to the 5 Most Dangerous Airlines In The World. Air transport is essential for the development of the global economy as it facilitates […] |
Citi names GM, Delta, KeyCorp as top stocks for 2024Citigroup (C) has unveiled its top stock picks for 2024. Despite macroeconomic uncertainty, Citi analysts have named Delta (DAL), United (UAL), Boeing (BA) in aviation, General Motors (GM) for autos, and regional lender KeyCorp (KEY) among stocks it expects to outperform in the new year. Yahoo Finance's Brian Sozzi and Brad Smith analyze Citi's forecasts, providing insights into how the stocks have been performing throughout 2023. For more expert insight and the latest market action, click here to watch this full episode of Yahoo Finance Live. |
DAL Price Returns
| 1-mo | -8.41% |
| 3-mo | -11.43% |
| 6-mo | 11.83% |
| 1-year | -2.86% |
| 3-year | 8.73% |
| 5-year | -27.32% |
| YTD | 10.16% |
| 2023 | 23.03% |
| 2022 | -15.92% |
| 2021 | -2.81% |
| 2020 | -30.77% |
| 2019 | 20.38% |
DAL Dividends
| Ex-Dividend Date | Type | Payout Amount | Change | ||||||
|---|---|---|---|---|---|---|---|---|---|
| Loading, please wait... | |||||||||
Continue Researching DAL
Want to do more research on Delta Air Lines Inc's stock and its price? Try the links below:Delta Air Lines Inc (DAL) Stock Price | Nasdaq
Delta Air Lines Inc (DAL) Stock Quote, History and News - Yahoo Finance
Delta Air Lines Inc (DAL) Stock Price and Basic Information | MarketWatch


Loading social stream, please wait...