
Darling Ingredients Inc. (DAR): Price and Financial Metrics
DAR Price/Volume Stats
| Current price | $38.87 | 52-week high | $71.60 |
| Prev. close | $39.58 | 52-week low | $33.94 |
| Day low | $38.32 | Volume | 3,956,900 |
| Day high | $39.88 | Avg. volume | 2,265,441 |
| 50-day MA | $38.17 | Dividend yield | N/A |
| 200-day MA | $42.89 | Market Cap | 6.21B |
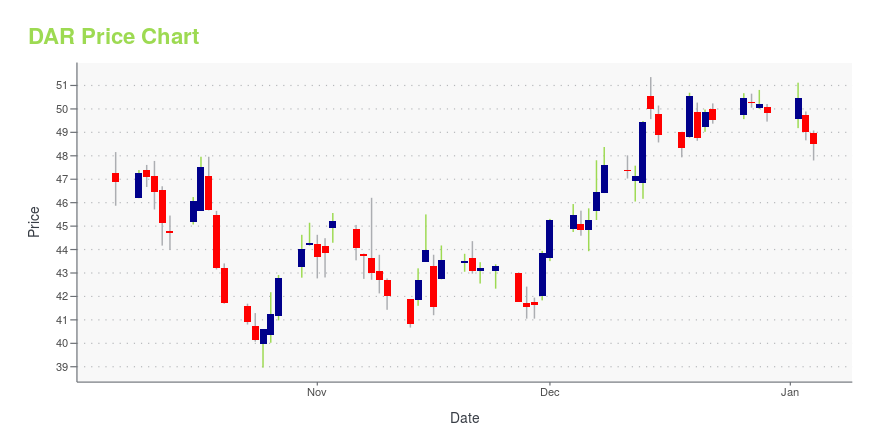
DAR Stock Price Chart Interactive Chart >
Darling Ingredients Inc. (DAR) Company Bio
Darling Ingredients is the world's largest publicly-traded developer and producer of sustainable natural ingredients from edible and inedible bio-nutrients, creating a wide range of ingredients and specialty products for customers in the pharmaceutical, food, pet food, feed, technical, fuel, bioenergy, and fertilizer industries. The company was founded in 1882 and is based in Irving, Texas.
Latest DAR News From Around the Web
Below are the latest news stories about DARLING INGREDIENTS INC that investors may wish to consider to help them evaluate DAR as an investment opportunity.
3 Contrarian Stock Plays for Bold Investors in 2024The rebound of stocks this year, despite the huge skepticism of much of the Street, showed how profitable contrarian stocks can be. |
New Strong Sell Stocks for December 22ndATRO, CASS and DAR have been added to the Zacks Rank #5 (Strong Sell) List on December 22, 2023. |
Do Options Traders Know Something About Darling Ingredients (DAR) Stock We Don't?Investors need to pay close attention to Darling Ingredients (DAR) stock based on the movements in the options market lately. |
7 Stocks with Strong Insider Buying: December 2023Stocks with strong insider buying should make you curious, and finding them can be a useful shortcut for your research |
Darling Ingredients Again Named to Newsweek's America's Most Responsible Companies ListDarling Ingredients Inc. (NYSE: DAR) has been recognized by Newsweek as one of America's Most Responsible Companies of 2024, ranking #129 of 600 companies headquartered in the United States and #13 of 48 companies within the Consumer Goods industry, as assessed by Newsweek and Statista Inc. The company consistently improved its ranking in recent years, moving up the list by more than 60 spots, compared to #191 in 2023 and more than 300 spots compared to #433 in 2022. The Newsweek rankings take a |
DAR Price Returns
| 1-mo | 8.67% |
| 3-mo | -12.98% |
| 6-mo | -11.96% |
| 1-year | -43.51% |
| 3-year | -42.66% |
| 5-year | 90.26% |
| YTD | -22.01% |
| 2023 | -20.37% |
| 2022 | -9.67% |
| 2021 | 20.13% |
| 2020 | 105.41% |
| 2019 | 45.95% |
Continue Researching DAR
Want to do more research on Darling Ingredients Inc's stock and its price? Try the links below:Darling Ingredients Inc (DAR) Stock Price | Nasdaq
Darling Ingredients Inc (DAR) Stock Quote, History and News - Yahoo Finance
Darling Ingredients Inc (DAR) Stock Price and Basic Information | MarketWatch
Loading social stream, please wait...