Dillard's, Inc. (DDS): Price and Financial Metrics
GET POWR RATINGS... FREE!
DDS POWR Grades
- Quality is the dimension where DDS ranks best; there it ranks ahead of 99.83% of US stocks.
- The strongest trend for DDS is in Quality, which has been heading up over the past 177 days.
- DDS's current lowest rank is in the Growth metric (where it is better than 16.63% of US stocks).
DDS Stock Summary
- The capital turnover (annual revenue relative to shareholder's equity) for DDS is 4.34 -- better than 88.78% of US stocks.
- DILLARD'S INC's stock had its IPO on June 30, 1989, making it an older stock than 89.73% of US equities in our set.
- DILLARD'S INC's shareholder yield -- a measure of how much capital is returned to stockholders via dividends and buybacks -- is 12.84%, greater than the shareholder yield of 88.03% of stocks in our set.
- If you're looking for stocks that are quantitatively similar to DILLARD'S INC, a group of peers worth examining would be BWA, MSB, VLGEA, ZEUS, and SAIA.
- DDS's SEC filings can be seen here. And to visit DILLARD'S INC's official web site, go to www.dillards.com.
DDS Valuation Summary
- DDS's price/earnings ratio is 7.1; this is 45.38% lower than that of the median Consumer Cyclical stock.
- DDS's price/earnings ratio has moved down 0.8 over the prior 243 months.
Below are key valuation metrics over time for DDS.
Stock | Date | P/S | P/B | P/E | EV/EBIT |
---|---|---|---|---|---|
DDS | 2023-01-26 | 0.9 | 4.1 | 7.1 | 5.5 |
DDS | 2023-01-25 | 0.9 | 4.0 | 7.0 | 5.5 |
DDS | 2023-01-24 | 0.9 | 3.9 | 6.8 | 5.3 |
DDS | 2023-01-23 | 0.9 | 4.0 | 6.9 | 5.4 |
DDS | 2023-01-20 | 0.9 | 3.9 | 6.8 | 5.3 |
DDS | 2023-01-19 | 0.9 | 4.0 | 6.9 | 5.4 |
DDS Growth Metrics
- Its 4 year net income to common stockholders growth rate is now at -181.91%.
- Its year over year revenue growth rate is now at 39.05%.
- The year over year price growth rate now stands at 80.74%.

The table below shows DDS's growth in key financial areas (numbers in millions of US dollars).
Date | Revenue | Operating Cash Flow | Net Income to Common Stock |
---|---|---|---|
2022-09-30 | 6,987.129 | 1,110.358 | 923.691 |
2022-06-30 | 6,925.969 | 1,066.769 | 933.112 |
2022-03-31 | 6,909.514 | 1,342.789 | 955.319 |
2021-12-31 | 6,624.267 | 1,280.02 | 862.473 |
2021-09-30 | 6,085.193 | 1,043.967 | 608.27 |
2021-06-30 | 5,625.393 | 1,039.756 | 442.79 |
DDS's Quality Factors
The “Quality” component of the POWR Ratings focuses on 31 different factors of a companies fundamentals and operational strength. Here are some key insights as we drill into the specifics of these quality attributes.- DDS has a Quality Grade of A, ranking ahead of 99.3% of graded US stocks.
- DDS's asset turnover comes in at 1.693 -- ranking 65th of 165 Retail stocks.
- HBI, RUSHA, and SPH are the stocks whose asset turnover ratios are most correlated with DDS.
The table below shows DDS's key quality metrics over time.
Period | Asset Turnover | Gross Margin | ROIC |
---|---|---|---|
2021-07-31 | 1.693 | 0.388 | 0.234 |
2021-05-01 | 1.530 | 0.365 | 0.121 |
2021-01-30 | 1.383 | 0.308 | -0.037 |
2020-10-31 | 1.453 | 0.302 | -0.045 |
2020-08-01 | 1.509 | 0.301 | -0.044 |
2020-05-02 | 1.609 | 0.295 | -0.050 |
DDS Price Target
For more insight on analysts targets of DDS, see our DDS price target page. And for a list of of all stocks sorted by upside potential based on analyst target price, see our Top Price Target page.
Average Price Target | $143.75 | Average Broker Recommendation | 2.33 (Moderate Sell) |
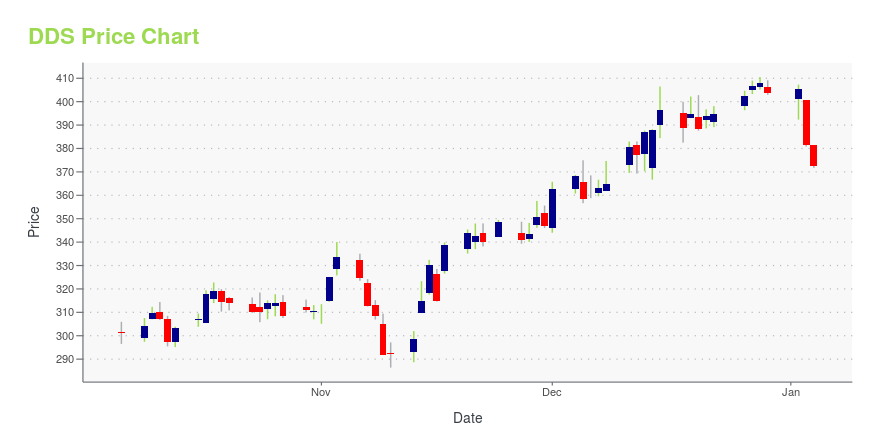
DDS Stock Price Chart Interactive Chart >
DDS Price/Volume Stats
Current price | $402.33 | 52-week high | $416.30 |
Prev. close | $406.75 | 52-week low | $193.00 |
Day low | $402.33 | Volume | 140,500 |
Day high | $416.30 | Avg. volume | 128,939 |
50-day MA | $350.47 | Dividend yield | 0.2% |
200-day MA | $301.96 | Market Cap | 6.89B |
Dillard's, Inc. (DDS) Company Bio
Dillard's Inc. operates as a fashion apparel, cosmetics, and home furnishing retailer in the United States. The company was founded in 1938 and is based in Little Rock, Arkansas.
Latest DDS News From Around the Web
Below are the latest news stories about DILLARD'S INC that investors may wish to consider to help them evaluate DDS as an investment opportunity.
Dillard's (DDS) Gains But Lags Market: What You Should KnowDillard's (DDS) closed at $394.56 in the latest trading session, marking a +0.32% move from the prior day. |
Dillard's (DDS) Outpaces Stock Market Gains: What You Should KnowIn the latest trading session, Dillard's (DDS) closed at $385.49, marking a +1.49% move from the previous day. |
Dillard's (DDS) Dips More Than Broader Markets: What You Should KnowDillard's (DDS) closed at $368.51 in the latest trading session, marking a -1.68% move from the prior day. |
Dillard’s to Donate more than $289,000 to local RMHC Chapters through sale of Southern Living Christmas CookbookLITTLE ROCK, Ark., January 20, 2023--Dillard’s, Inc. (DDS: NYSE, "Dillard’s") announced today that it will make a significant contribution of more than $289,000 to local Ronald McDonald House Charities (RMHC) Chapters. This donation was made possible through the sale of Dillard’s exclusive Southern Living Christmas Cookbook. |
Dillard's (DDS) Gains As Market Dips: What You Should KnowDillard's (DDS) closed at $377.71 in the latest trading session, marking a +1.08% move from the prior day. |
DDS Price Returns
1-mo | 21.05% |
3-mo | 27.60% |
6-mo | 69.89% |
1-year | 62.92% |
3-year | 568.01% |
5-year | 580.63% |
YTD | 24.48% |
2022 | 38.66% |
2021 | 290.27% |
2020 | -12.71% |
2019 | 22.76% |
2018 | 0.97% |
DDS Dividends
Ex-Dividend Date | Type | Payout Amount | Change | ||||||
---|---|---|---|---|---|---|---|---|---|
Loading, please wait... |
Continue Researching DDS
Want to see what other sources are saying about Dillard'S Inc's financials and stock price? Try the links below:Dillard'S Inc (DDS) Stock Price | Nasdaq
Dillard'S Inc (DDS) Stock Quote, History and News - Yahoo Finance
Dillard'S Inc (DDS) Stock Price and Basic Information | MarketWatch
Loading social stream, please wait...