
Easterly Government Properties, Inc. (DEA): Price and Financial Metrics
DEA Price/Volume Stats
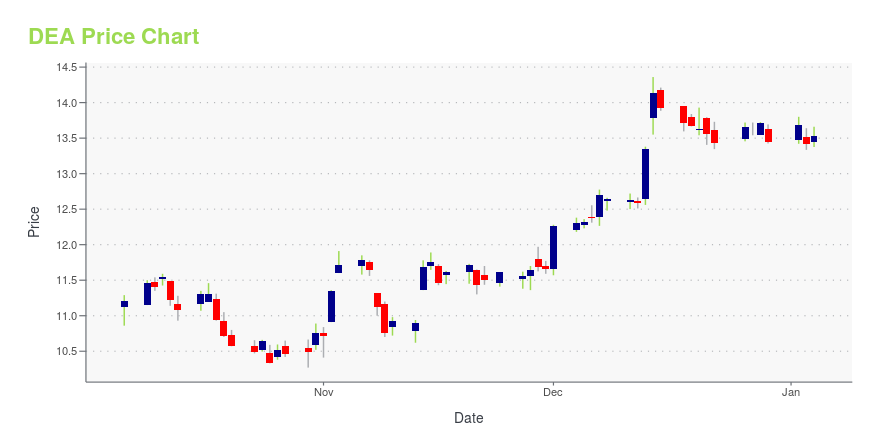
| Current price | $13.95 | 52-week high | $15.21 |
| Prev. close | $13.70 | 52-week low | $10.27 |
| Day low | $13.77 | Volume | 539,400 |
| Day high | $13.98 | Avg. volume | 876,301 |
| 50-day MA | $12.45 | Dividend yield | 7.7% |
| 200-day MA | $12.07 | Market Cap | 1.44B |
DEA Stock Price Chart Interactive Chart >
Easterly Government Properties, Inc. (DEA) Company Bio
Easterly Government Properties, Inc. focuses on the acquisition, development, and management of general services administration commercial properties in the United States. The company is based in Washington, District of Columbia.
Latest DEA News From Around the Web
Below are the latest news stories about EASTERLY GOVERNMENT PROPERTIES INC that investors may wish to consider to help them evaluate DEA as an investment opportunity.
Insider Buying: Chairman Darrell Crate Acquires 8,000 Shares of Easterly Government Properties IncIn the realm of stock market movements, insider trading activity is often a significant indicator that can provide insights into a company's potential future performance. |
Government Property Owner Easterly Names New CEO(Bloomberg) -- Easterly Government Properties Inc. said it has elevated co-founder and current board Chairman Darrell Crate to chief executive officer, effective at the beginning of next year. Most Read from BloombergElon Musk's SpaceX Valued at $175 Billion or More in Tender OfferAI Powers Nasdaq 100 Rebound as Tech Storms Back: Markets WrapApple Readies New iPads and M3 MacBook Air to Combat Sales SlumpHarvard, Penn Heads Walk Back Genocide Answers After BacklashBiden Moves to Forgive Nearly $ |
Easterly Government Properties Appoints Co-Founder Darrell Crate as CEO to Advance Mission-Critical Real Estate StrategyWASHINGTON, December 07, 2023--Easterly Government Properties, Inc. (NYSE: DEA) (the "Company" or "Easterly"), a fully integrated real estate investment trust ("REIT") focused primarily on the acquisition, development and management of Class A commercial properties leased to the U.S. Government, today announced that Darrell Crate, the Co-Founder and current Chairman of the Board, has been appointed as Chief Executive Officer (CEO), effective January 1, 2024. |
Easterly Government Properties to Participate in Nareit’s REITworld 2023 Annual ConferenceWASHINGTON, November 14, 2023--Easterly Government Properties, Inc. (NYSE: DEA) (the "Company" or "Easterly"), a fully integrated real estate investment trust ("REIT") focused primarily on the acquisition, development and management of Class A commercial properties leased to the U.S. Government, announced today that management will participate in investor meetings at Nareit’s REITworld 2023 Annual Conference in Los Angeles, California on November 15, 2023. |
Easterly Government Properties Releases Annual Environmental, Social, and Governance (ESG) ReportWASHINGTON, November 08, 2023--Easterly Government Properties, Inc. (NYSE: DEA) (the "Company"), a fully integrated real estate investment trust focused primarily on the acquisition, development and management of Class A commercial properties leased to U.S. Government agencies, announced today that it has released its annual Environmental, Social, and Governance report (the "ESG Report"). |
DEA Price Returns
| 1-mo | 14.91% |
| 3-mo | 22.04% |
| 6-mo | 14.70% |
| 1-year | 4.09% |
| 3-year | -23.74% |
| 5-year | 1.02% |
| YTD | 8.55% |
| 2023 | 1.82% |
| 2022 | -34.04% |
| 2021 | 6.32% |
| 2020 | -0.31% |
| 2019 | 59.49% |
DEA Dividends
| Ex-Dividend Date | Type | Payout Amount | Change | ||||||
|---|---|---|---|---|---|---|---|---|---|
| Loading, please wait... | |||||||||
Continue Researching DEA
Here are a few links from around the web to help you further your research on Easterly Government Properties Inc's stock as an investment opportunity:Easterly Government Properties Inc (DEA) Stock Price | Nasdaq
Easterly Government Properties Inc (DEA) Stock Quote, History and News - Yahoo Finance
Easterly Government Properties Inc (DEA) Stock Price and Basic Information | MarketWatch
Loading social stream, please wait...