Douglas Emmett, Inc. (DEI): Price and Financial Metrics
DEI Price/Volume Stats
Current price | $12.65 | 52-week high | $18.98 |
Prev. close | $12.76 | 52-week low | $10.09 |
Day low | $12.49 | Volume | 814,725 |
Day high | $12.83 | Avg. volume | 2,862,465 |
50-day MA | $13.59 | Dividend yield | 6.05% |
200-day MA | $13.58 | Market Cap | 2.11B |
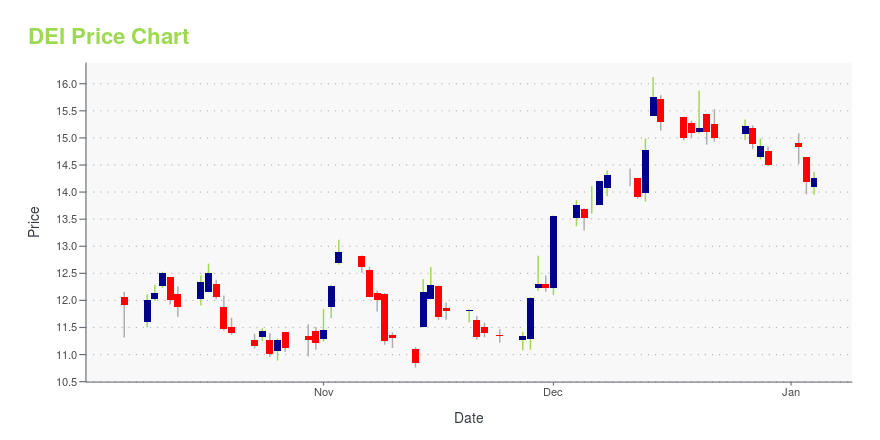
DEI Stock Price Chart Interactive Chart >
DEI POWR Grades
- Momentum is the dimension where DEI ranks best; there it ranks ahead of 57.65% of US stocks.
- The strongest trend for DEI is in Growth, which has been heading down over the past 177 days.
- DEI ranks lowest in Sentiment; there it ranks in the 0th percentile.
DEI Stock Summary
- With a price/earnings ratio of 36.05, DOUGLAS EMMETT INC P/E ratio is greater than that of about 82.28% of stocks in our set with positive earnings.
- Of note is the ratio of DOUGLAS EMMETT INC's sales and general administrative expense to its total operating expenses; just 3.37% of US stocks have a lower such ratio.
- The ratio of debt to operating expenses for DOUGLAS EMMETT INC is higher than it is for about 93.73% of US stocks.
- Stocks that are quantitatively similar to DEI, based on their financial statements, market capitalization, and price volatility, are PZZA, CWST, NDAQ, TSQ, and ARKO.
- DEI's SEC filings can be seen here. And to visit DOUGLAS EMMETT INC's official web site, go to www.douglasemmett.com.
DEI Valuation Summary
- In comparison to the median Real Estate stock, DEI's EV/EBIT ratio is 13.87% higher, now standing at 31.2.
- DEI's price/earnings ratio has moved up 204.5 over the prior 206 months.
Below are key valuation metrics over time for DEI.
Stock | Date | P/S | P/B | P/E | EV/EBIT |
---|---|---|---|---|---|
DEI | 2023-09-20 | 2.2 | 0.9 | 38.6 | 31.2 |
DEI | 2023-09-19 | 2.2 | 0.9 | 38.6 | 31.1 |
DEI | 2023-09-18 | 2.2 | 0.9 | 38.3 | 31.1 |
DEI | 2023-09-15 | 2.2 | 0.9 | 38.6 | 31.1 |
DEI | 2023-09-14 | 2.2 | 0.9 | 38.2 | 31.1 |
DEI | 2023-09-13 | 2.1 | 0.9 | 37.0 | 30.7 |
DEI Growth Metrics
- Its 2 year net cashflow from operations growth rate is now at -5.96%.
- Its 4 year cash and equivalents growth rate is now at 104.24%.
- Its 4 year revenue growth rate is now at 25.43%.

The table below shows DEI's growth in key financial areas (numbers in millions of US dollars).
Date | Revenue | Operating Cash Flow | Net Income to Common Stock |
---|---|---|---|
2022-12-31 | 993.652 | 496.888 | 97.145 |
2022-09-30 | 978.367 | 489.038 | 92.171 |
2022-06-30 | 962.948 | 480.603 | 87.357 |
2022-03-31 | 940.984 | 461.377 | 79.18 |
2021-12-31 | 918.397 | 446.951 | 65.267 |
2021-09-30 | 894.935 | 403.071 | 63.634 |
DEI's Quality Factors
The “Quality” component of the POWR Ratings focuses on 31 different factors of a companies fundamentals and operational strength. Here are some key insights as we drill into the specifics of these quality attributes.- DEI has a Quality Grade of C, ranking ahead of 34.14% of graded US stocks.
- DEI's asset turnover comes in at 0.094 -- ranking 226th of 444 Trading stocks.
- BXP, BDN, and EQR are the stocks whose asset turnover ratios are most correlated with DEI.
The table below shows DEI's key quality metrics over time.
Period | Asset Turnover | Gross Margin | ROIC |
---|---|---|---|
2021-06-30 | 0.094 | 0.655 | 0.014 |
2021-03-31 | 0.092 | 0.652 | 0.013 |
2020-12-31 | 0.096 | 0.657 | 0.014 |
2020-09-30 | 0.099 | 0.670 | 0.033 |
2020-06-30 | 0.103 | 0.678 | 0.035 |
2020-03-31 | 0.108 | 0.682 | 0.038 |
DEI Price Target
For more insight on analysts targets of DEI, see our DEI price target page. And for a list of of all stocks sorted by upside potential based on analyst target price, see our Top Price Target page.
Average Price Target | $36.25 | Average Broker Recommendation | 1.9 (Hold) |
Douglas Emmett, Inc. (DEI) Company Bio
Douglas Emmett owns and operates office and multifamily properties located in the coastal submarkets of Los Angeles and Honolulu. The company was founded in 1971 and is based in Santa Monica, California.
Latest DEI News From Around the Web
Below are the latest news stories about DOUGLAS EMMETT INC that investors may wish to consider to help them evaluate DEI as an investment opportunity.
Q2 2023 Douglas Emmett Inc Earnings CallQ2 2023 Douglas Emmett Inc Earnings Call |
Here's What Key Metrics Tell Us About Douglas Emmett (DEI) Q2 EarningsThe headline numbers for Douglas Emmett (DEI) give insight into how the company performed in the quarter ended June 2023, but it may be worthwhile to compare some of its key metrics to Wall Street estimates and the year-ago actuals. |
Douglas Emmett (DEI) Q2 FFO and Revenues Top EstimatesDouglas Emmett (DEI) delivered FFO and revenue surprises of 2.13% and 0.01%, respectively, for the quarter ended June 2023. Do the numbers hold clues to what lies ahead for the stock? |
Douglas Emmett Releases Second Quarter 2023 Earnings ResultsSANTA MONICA, Calif., August 01, 2023--Douglas Emmett, Inc. (NYSE: DEI), a real estate investment trust (REIT), has released its Second Quarter 2023 Earnings Results and Operating Information package by posting it to the investor relations section of its website at www.douglasemmett.com/investors. |
First Industrial Realty Trust (FR) Q2 FFO and Revenues Surpass EstimatesFirst Industrial Realty Trust (FR) delivered FFO and revenue surprises of 1.67% and 3.06%, respectively, for the quarter ended June 2023. Do the numbers hold clues to what lies ahead for the stock? |
DEI Price Returns
1-mo | -5.03% |
3-mo | 3.86% |
6-mo | 6.97% |
1-year | -27.05% |
3-year | -41.19% |
5-year | -59.07% |
YTD | -16.78% |
2022 | -50.89% |
2021 | 18.75% |
2020 | -30.86% |
2019 | 31.96% |
2018 | -14.54% |
DEI Dividends
Ex-Dividend Date | Type | Payout Amount | Change | ||||||
---|---|---|---|---|---|---|---|---|---|
Loading, please wait... |
Continue Researching DEI
Here are a few links from around the web to help you further your research on Douglas Emmett Inc's stock as an investment opportunity:Douglas Emmett Inc (DEI) Stock Price | Nasdaq
Douglas Emmett Inc (DEI) Stock Quote, History and News - Yahoo Finance
Douglas Emmett Inc (DEI) Stock Price and Basic Information | MarketWatch
Loading social stream, please wait...