
Dell Technologies Inc (DELL): Price and Financial Metrics
DELL Price/Volume Stats
| Current price | $113.56 | 52-week high | $179.70 |
| Prev. close | $111.43 | 52-week low | $52.05 |
| Day low | $111.55 | Volume | 8,419,931 |
| Day high | $114.72 | Avg. volume | 10,080,653 |
| 50-day MA | $139.93 | Dividend yield | 1.41% |
| 200-day MA | $103.59 | Market Cap | 80.55B |
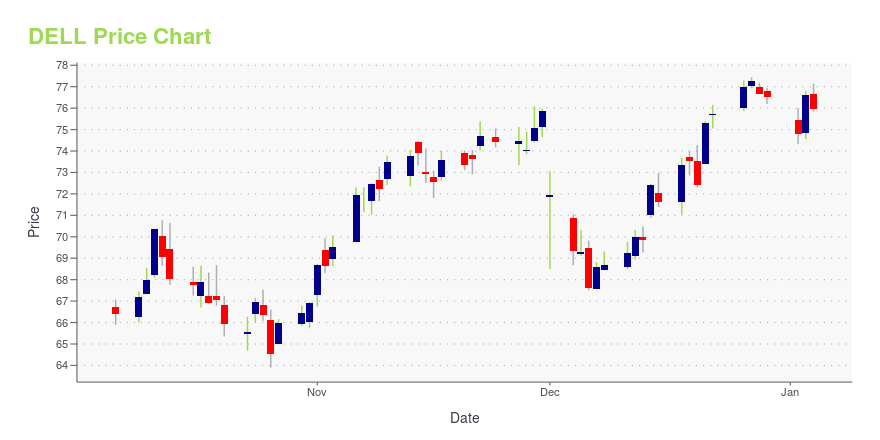
DELL Stock Price Chart Interactive Chart >
Dell Technologies Inc (DELL) Company Bio
Dell is an American multinational computer technology company based in Round Rock, Texas, United States, that develops, sells, repairs, and supports computers and related products and services. Named after its founder, Michael Dell, the company is one of the largest technological corporations in the world, employing more than 103,300 people in the U.S. and around the world.
Latest DELL News From Around the Web
Below are the latest news stories about DELL TECHNOLOGIES INC that investors may wish to consider to help them evaluate DELL as an investment opportunity.
The 7 Highest-Yielding Dividend Gems in Warren Buffet’s CrownWarren Buffett doesn’t hide the fact he loves dividends. |
25 Technologies That Have Changed the WorldIn this article, we will be analyzing the evolution of technology while covering the 25 technologies that have changed the world. If you wish to skip our detailed analysis, you can move directly to the 5 Technologies That Have Changed the World. Technology Over the Years Following the dot com bubble burst, technology successfully rebounded. […] |
Best High-Dividend Stocks 2024: 3 Names to Add to Your Must-Buy ListInvestors who prize dividends and rely on the payments for income should consider these top dividend stocks. |
Dell Technologies Announces Pricing Terms for Cash Tender Offers for Certain Outstanding Debt SecuritiesDell Technologies Inc. ("Dell Technologies") (NYSE:DELL) today announced the pricing terms of the previously announced cash tender offers (collectively, the "Offers") by Dell Inc., its wholly-owned subsidiary ("Dell"). Dell expects to accept for purchase $350,000,000 in aggregate principal amount of the 3.450% Senior Notes due 2051 and $150,000,000 aggregate principal amount of the 8.350% Senior Notes due 2046 that were validly tendered and not validly withdrawn at or before the Early Tender Dea |
Subdued Growth No Barrier To Dell Technologies Inc.'s (NYSE:DELL) PriceWith a price-to-earnings (or "P/E") ratio of 19.1x Dell Technologies Inc. ( NYSE:DELL ) may be sending bearish signals... |
DELL Price Returns
| 1-mo | -17.57% |
| 3-mo | -8.88% |
| 6-mo | 35.83% |
| 1-year | 115.15% |
| 3-year | 152.31% |
| 5-year | 338.61% |
| YTD | 50.21% |
| 2023 | 95.85% |
| 2022 | -26.63% |
| 2021 | 53.28% |
| 2020 | 42.62% |
| 2019 | 5.16% |
DELL Dividends
| Ex-Dividend Date | Type | Payout Amount | Change | ||||||
|---|---|---|---|---|---|---|---|---|---|
| Loading, please wait... | |||||||||
Continue Researching DELL
Want to see what other sources are saying about Dell Technologies Inc's financials and stock price? Try the links below:Dell Technologies Inc (DELL) Stock Price | Nasdaq
Dell Technologies Inc (DELL) Stock Quote, History and News - Yahoo Finance
Dell Technologies Inc (DELL) Stock Price and Basic Information | MarketWatch
Loading social stream, please wait...