
Dream Finders Homes, Inc. (DFH): Price and Financial Metrics
DFH Price/Volume Stats
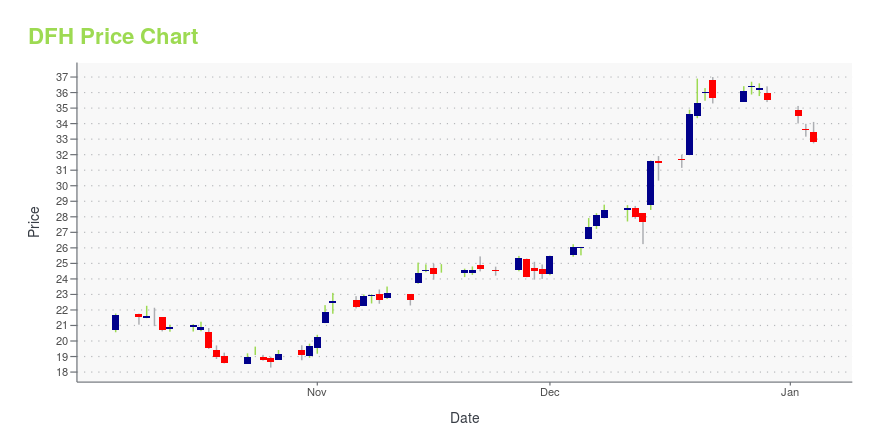
| Current price | $32.68 | 52-week high | $44.38 |
| Prev. close | $31.55 | 52-week low | $18.29 |
| Day low | $32.01 | Volume | 450,946 |
| Day high | $34.24 | Avg. volume | 426,981 |
| 50-day MA | $27.63 | Dividend yield | N/A |
| 200-day MA | $30.58 | Market Cap | 3.05B |
DFH Stock Price Chart Interactive Chart >
Dream Finders Homes, Inc. (DFH) Company Bio
Dream Finders Homes, Inc. provides construction services. The Company designs, builds, and sells single family homes and apartments. Dream Finders Homes serves customers in the United States.
Latest DFH News From Around the Web
Below are the latest news stories about DREAM FINDERS HOMES INC that investors may wish to consider to help them evaluate DFH as an investment opportunity.
3 Stocks to Buy That Are Up 200% or More in 2023With approximately 24 U.S.-listed stocks up 200% or more in 2023, three stand out as stocks to buy for 2024 and beyond. |
Why Fast-paced Mover Dream Finders Homes (DFH) Is a Great Choice for Value InvestorsIf you are looking for stocks that have gained strong momentum recently but are still trading at reasonable prices, Dream Finders Homes (DFH) could be a great choice. It is one of the several stocks that passed through our 'Fast-Paced Momentum at a Bargain' screen. |
Is the Options Market Predicting a Spike in Dream Finders (DFH) Stock?Investors need to pay close attention to Dream Finders (DFH) stock based on the movements in the options market lately. |
Dream Finders Homes (DFH) Upgraded to Strong Buy: Here's What You Should KnowDream Finders Homes (DFH) has been upgraded to a Zacks Rank #1 (Strong Buy), reflecting growing optimism about the company's earnings prospects. This might drive the stock higher in the near term. |
Dream Finders Announces Third Quarter 2023 ResultsJACKSONVILLE, Fla., November 02, 2023--Dream Finders Homes, Inc. (the "Company", "Dream Finders Homes", "Dream Finders" or "DFH") (NYSE: DFH) announced its financial results for the third quarter ended September 30, 2023. |
DFH Price Returns
| 1-mo | 31.77% |
| 3-mo | -9.95% |
| 6-mo | 2.16% |
| 1-year | 36.51% |
| 3-year | 49.63% |
| 5-year | N/A |
| YTD | -8.02% |
| 2023 | 310.28% |
| 2022 | -55.48% |
| 2021 | N/A |
| 2020 | N/A |
| 2019 | N/A |
Loading social stream, please wait...