Dine Brands Global, Inc. (DIN): Price and Financial Metrics
GET POWR RATINGS... FREE!
DIN POWR Grades
- DIN scores best on the Quality dimension, with a Quality rank ahead of 85.02% of US stocks.
- DIN's strongest trending metric is Sentiment; it's been moving down over the last 178 days.
- DIN's current lowest rank is in the Sentiment metric (where it is better than 14.49% of US stocks).
DIN Stock Summary
- DINE BRANDS GLOBAL INC's capital turnover -- a measure of revenue relative to shareholder's equity -- is better than merely 3.54% of US listed stocks.
- The ratio of debt to operating expenses for DINE BRANDS GLOBAL INC is higher than it is for about 90.37% of US stocks.
- Equity multiplier, or assets relative to shareholders' equity, comes in at -6.48 for DINE BRANDS GLOBAL INC; that's greater than it is for just 2.73% of US stocks.
- If you're looking for stocks that are quantitatively similar to DINE BRANDS GLOBAL INC, a group of peers worth examining would be BRBR, HLX, SABR, VMC, and TNL.
- DIN's SEC filings can be seen here. And to visit DINE BRANDS GLOBAL INC's official web site, go to www.dinebrands.com.
DIN Valuation Summary
- DIN's EV/EBIT ratio is 14.1; this is 6.82% higher than that of the median Consumer Cyclical stock.
- Over the past 243 months, DIN's EV/EBIT ratio has gone up 5.7.
Below are key valuation metrics over time for DIN.
Stock | Date | P/S | P/B | P/E | EV/EBIT |
---|---|---|---|---|---|
DIN | 2023-03-16 | 1.1 | -3.5 | 13.2 | 14.1 |
DIN | 2023-03-15 | 1.1 | -3.4 | 12.8 | 13.9 |
DIN | 2023-03-14 | 1.1 | -3.4 | 13.0 | 14.0 |
DIN | 2023-03-13 | 1.1 | -3.4 | 13.1 | 14.1 |
DIN | 2023-03-10 | 1.2 | -3.5 | 13.4 | 14.2 |
DIN | 2023-03-09 | 1.2 | -3.6 | 13.7 | 14.3 |
DIN Growth Metrics
- Its 4 year net income to common stockholders growth rate is now at 7.38%.
- Its 5 year price growth rate is now at -13.91%.
- The 2 year net income to common stockholders growth rate now stands at 3.4%.

The table below shows DIN's growth in key financial areas (numbers in millions of US dollars).
Date | Revenue | Operating Cash Flow | Net Income to Common Stock |
---|---|---|---|
2022-09-30 | 931.067 | 113.763 | 87.327 |
2022-06-30 | 926.566 | 119.698 | 89.563 |
2022-03-31 | 922.391 | 157.48 | 94.979 |
2021-12-31 | 896.167 | 195.835 | 95.569 |
2021-09-30 | 862.566 | 205.337 | 74.808 |
2021-06-30 | 810.49 | 213.036 | 61.888 |
DIN's Quality Factors
The “Quality” component of the POWR Ratings focuses on 31 different factors of a companies fundamentals and operational strength. Here are some key insights as we drill into the specifics of these quality attributes.- DIN has a Quality Grade of B, ranking ahead of 94.5% of graded US stocks.
- DIN's asset turnover comes in at 0.41 -- ranking 51st of 79 Restaraunts Hotels Motels stocks.
- YUM, QSR, and TNL are the stocks whose asset turnover ratios are most correlated with DIN.
The table below shows DIN's key quality metrics over time.
Period | Asset Turnover | Gross Margin | ROIC |
---|---|---|---|
2021-06-30 | 0.410 | 0.393 | 0.057 |
2021-03-31 | 0.341 | 0.364 | -0.018 |
2020-12-31 | 0.329 | 0.361 | -0.016 |
2020-09-30 | 0.345 | 0.384 | -0.003 |
2020-06-30 | 0.368 | 0.394 | 0.005 |
2020-03-31 | 0.425 | 0.414 | 0.073 |
DIN Price Target
For more insight on analysts targets of DIN, see our DIN price target page. And for a list of of all stocks sorted by upside potential based on analyst target price, see our Top Price Target page.
Average Price Target | $109.44 | Average Broker Recommendation | 1.5 (Moderate Buy) |
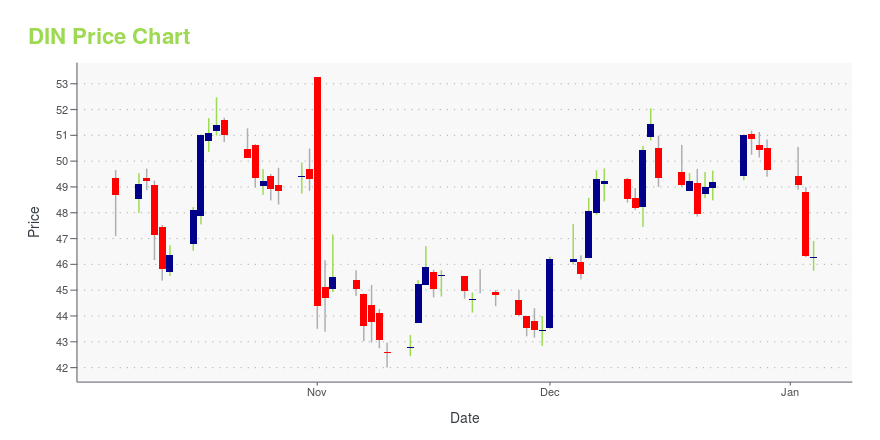
DIN Stock Price Chart Interactive Chart >
DIN Price/Volume Stats
Current price | $68.54 | 52-week high | $82.43 |
Prev. close | $67.21 | 52-week low | $61.03 |
Day low | $68.32 | Volume | 263,100 |
Day high | $69.54 | Avg. volume | 275,239 |
50-day MA | $74.92 | Dividend yield | 3.11% |
200-day MA | $70.82 | Market Cap | 1.07B |
Dine Brands Global, Inc. (DIN) Company Bio
Dine Brands Global owns, franchises, and operates full-service restaurants in the United States and internationally. The company owns and operates two restaurant concepts, including Applebee's Neighborhood Grill & Bar and International House of Pancakes (IHOP) in the family dining category of the restaurant industry. The company was founded in 1958 and is based in Glendale, California.
Latest DIN News From Around the Web
Below are the latest news stories about DINE BRANDS GLOBAL INC that investors may wish to consider to help them evaluate DIN as an investment opportunity.
Is It Smart To Buy Dine Brands Global, Inc. (NYSE:DIN) Before It Goes Ex-Dividend?Readers hoping to buy Dine Brands Global, Inc. ( NYSE:DIN ) for its dividend will need to make their move shortly, as... |
Dine Brands Analyst Says Underlying Trends Are Bit Difficult To Discern Given Omicron Laps In Recent MonthsRaymond James analyst Brian M.Vaccaro reiterated a Market Perform rating on the shares of Dine Brands Global, Inc. (NYSE: DIN). Dine Brands reported a 9.4% sales decline in Q4 to $207.97 million, missing the Street view. The analyst hosted a fireside chat with Dine Brands' CFO Vance Chang, during the 44th Raymond James Institutional Investor Conference. Management noted that it has yet to see any meaningful shifts in consumer behavior, attach rates, etc in recent quarters. Underlying trends are |
Dine Brands Global, Inc. (NYSE:DIN) Q4 2022 Earnings Call TranscriptDine Brands Global, Inc. (NYSE:DIN) Q4 2022 Earnings Call Transcript March 1, 2023 Operator: Good day. And thank you for standing by. Welcome to the Dine Brands Global Fourth Quarter and Fiscal 2022 Conference Call. At this time all participants are in a listen-only mode. After the speakers presentation there will be a question-and-answer session. […] |
INTERVIEW: IHOP and Applebee's Owner Planning Menu Overhaul Post-AcquisitionDine Brands CEO John Peyton talked to TheStreet about inflation, a new acquisition and dining trends. |
Dine Brands Global Full Year 2022 Earnings: EPS Misses ExpectationsDine Brands Global ( NYSE:DIN ) Full Year 2022 Results Key Financial Results Revenue: US$909.4m (up 1.5% from FY 2021... |
DIN Price Returns
1-mo | N/A |
3-mo | 5.42% |
6-mo | 10.61% |
1-year | -8.26% |
3-year | 310.27% |
5-year | 20.84% |
YTD | 6.92% |
2022 | -12.36% |
2021 | 31.43% |
2020 | -27.31% |
2019 | 28.20% |
2018 | 37.27% |
DIN Dividends
Ex-Dividend Date | Type | Payout Amount | Change | ||||||
---|---|---|---|---|---|---|---|---|---|
Loading, please wait... |
Continue Researching DIN
Want to see what other sources are saying about Dine Brands Global Inc's financials and stock price? Try the links below:Dine Brands Global Inc (DIN) Stock Price | Nasdaq
Dine Brands Global Inc (DIN) Stock Quote, History and News - Yahoo Finance
Dine Brands Global Inc (DIN) Stock Price and Basic Information | MarketWatch
Loading social stream, please wait...