
HF Sinclair Corp. (DINO): Price and Financial Metrics
DINO Price/Volume Stats
| Current price | $50.63 | 52-week high | $64.16 |
| Prev. close | $49.80 | 52-week low | $47.09 |
| Day low | $49.27 | Volume | 2,058,600 |
| Day high | $50.89 | Avg. volume | 1,977,287 |
| 50-day MA | $52.52 | Dividend yield | 4.17% |
| 200-day MA | $55.34 | Market Cap | 9.73B |
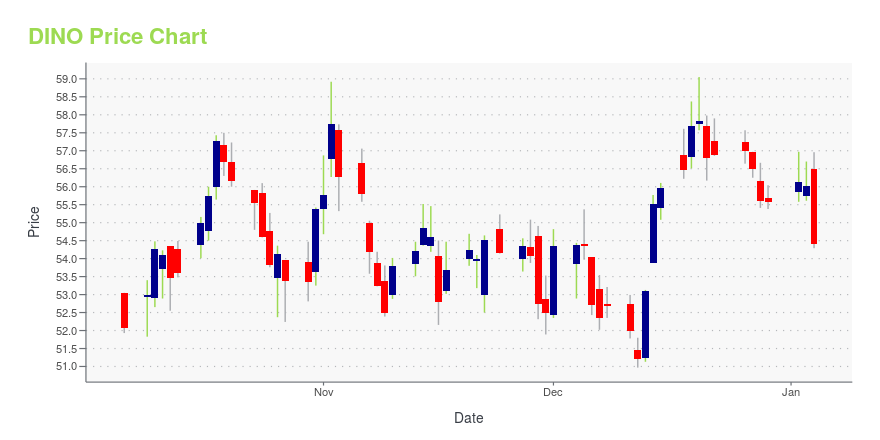
DINO Stock Price Chart Interactive Chart >
HF Sinclair Corp. (DINO) Company Bio
Operates oil refineries, pipelines and exploration services
Latest DINO News From Around the Web
Below are the latest news stories about HF SINCLAIR CORP that investors may wish to consider to help them evaluate DINO as an investment opportunity.
Is HF Sinclair Corporation's (NYSE:DINO) Recent Performance Tethered To Its Attractive Financial Prospects?HF Sinclair's (NYSE:DINO) stock is up by 4.4% over the past month. Given its impressive performance, we decided to... |
With 72% ownership of the shares, HF Sinclair Corporation (NYSE:DINO) is heavily dominated by institutional ownersKey Insights Institutions' substantial holdings in HF Sinclair implies that they have significant influence over the... |
Director Franklin Myers Bolsters Position in HF Sinclair Corp with Recent PurchaseInsider buying can often provide valuable insights into a company's prospects and the confidence that management and directors have in the business. |
Insider Sell: EVP, General Counsel & Sec Vaishali Bhatia Sells 18,465 Shares of HF Sinclair ...HF Sinclair Corp (NYSE:DINO), a diversified energy company, has recently witnessed a significant insider sell by one of its top executives. |
HF Sinclair Corporation Completes Acquisition of Holly Energy Partners, L.P.DALLAS, December 01, 2023--HF Sinclair Corporation (NYSE: DINO) ("HF Sinclair") today announced the completion of the transactions contemplated by the previously announced Agreement and Plan of Merger, pursuant to which HF Sinclair acquired all of the outstanding common units ("HEP Common Units") representing limited partner interests in Holly Energy Partners, L.P. ("HEP") not already owned by HF Sinclair and its subsidiaries, for a combination of 0.3150 of a share of HF Sinclair common stock an |
DINO Price Returns
| 1-mo | -3.98% |
| 3-mo | -10.88% |
| 6-mo | -7.44% |
| 1-year | 1.48% |
| 3-year | 83.25% |
| 5-year | 18.42% |
| YTD | -7.29% |
| 2023 | 11.04% |
| 2022 | 61.94% |
| 2021 | 27.97% |
| 2020 | -46.47% |
| 2019 | 1.94% |
DINO Dividends
| Ex-Dividend Date | Type | Payout Amount | Change | ||||||
|---|---|---|---|---|---|---|---|---|---|
| Loading, please wait... | |||||||||
Loading social stream, please wait...