Digital Realty Trust Inc. (DLR): Price and Financial Metrics
GET POWR RATINGS... FREE!
DLR POWR Grades
- Stability is the dimension where DLR ranks best; there it ranks ahead of 58.57% of US stocks.
- DLR's strongest trending metric is Growth; it's been moving up over the last 177 days.
- DLR's current lowest rank is in the Sentiment metric (where it is better than 5.13% of US stocks).
DLR Stock Summary
- With a market capitalization of $27,476,500,434, DIGITAL REALTY TRUST INC has a greater market value than 92.17% of US stocks.
- DLR's current price/earnings ratio is 81.54, which is higher than 94.06% of US stocks with positive earnings.
- Of note is the ratio of DIGITAL REALTY TRUST INC's sales and general administrative expense to its total operating expenses; just 7.28% of US stocks have a lower such ratio.
- Stocks that are quantitatively similar to DLR, based on their financial statements, market capitalization, and price volatility, are FANG, DVN, EQR, AVB, and WPC.
- Visit DLR's SEC page to see the company's official filings. To visit the company's web site, go to www.digitalrealty.com.
DLR Valuation Summary
- DLR's EV/EBIT ratio is 63.7; this is 142.21% higher than that of the median Real Estate stock.
- DLR's price/sales ratio has moved NA NA over the prior 224 months.
Below are key valuation metrics over time for DLR.
Stock | Date | P/S | P/B | P/E | EV/EBIT |
---|---|---|---|---|---|
DLR | 2023-03-23 | 5.8 | 1.5 | 80.8 | 63.7 |
DLR | 2023-03-22 | 5.7 | 1.5 | 79.7 | 63.2 |
DLR | 2023-03-21 | 6.1 | 1.6 | 84.5 | 65.5 |
DLR | 2023-03-20 | 6.3 | 1.7 | 87.8 | 67.1 |
DLR | 2023-03-17 | 6.2 | 1.7 | 87.0 | 66.7 |
DLR | 2023-03-16 | 6.4 | 1.7 | 89.1 | 67.7 |
DLR Growth Metrics
- Its 2 year net cashflow from operations growth rate is now at 18.87%.
- Its year over year net income to common stockholders growth rate is now at 216.98%.
- Its year over year cash and equivalents growth rate is now at -28.57%.

The table below shows DLR's growth in key financial areas (numbers in millions of US dollars).
Date | Revenue | Operating Cash Flow | Net Income to Common Stock |
---|---|---|---|
2022-09-30 | 4,569.894 | 1,654.902 | 1,400.869 |
2022-06-30 | 4,510.947 | 1,635.884 | 1,298.069 |
2022-03-31 | 4,464.813 | 1,652.038 | 1,372.192 |
2021-12-31 | 4,427.882 | 1,702.228 | 1,681.498 |
2021-09-30 | 4,379.324 | 1,776.092 | 668.046 |
2021-06-30 | 4,270.856 | 1,844.093 | 506.582 |
DLR's Quality Factors
The “Quality” component of the POWR Ratings focuses on 31 different factors of a companies fundamentals and operational strength. Here are some key insights as we drill into the specifics of these quality attributes.- DLR has a Quality Grade of D, ranking ahead of 18.97% of graded US stocks.
- DLR's asset turnover comes in at 0.119 -- ranking 163rd of 444 Trading stocks.
- SPG, HT, and AVCT are the stocks whose asset turnover ratios are most correlated with DLR.
The table below shows DLR's key quality metrics over time.
Period | Asset Turnover | Gross Margin | ROIC |
---|---|---|---|
2021-06-30 | 0.119 | 0.654 | 0.024 |
2021-03-31 | 0.118 | 0.658 | 0.023 |
2020-12-31 | 0.113 | 0.659 | 0.020 |
2020-09-30 | 0.116 | 0.666 | 0.029 |
2020-06-30 | 0.120 | 0.674 | 0.032 |
2020-03-31 | 0.125 | 0.680 | 0.032 |
DLR Price Target
For more insight on analysts targets of DLR, see our DLR price target page. And for a list of of all stocks sorted by upside potential based on analyst target price, see our Top Price Target page.
Average Price Target | $166.32 | Average Broker Recommendation | 1.57 (Moderate Buy) |
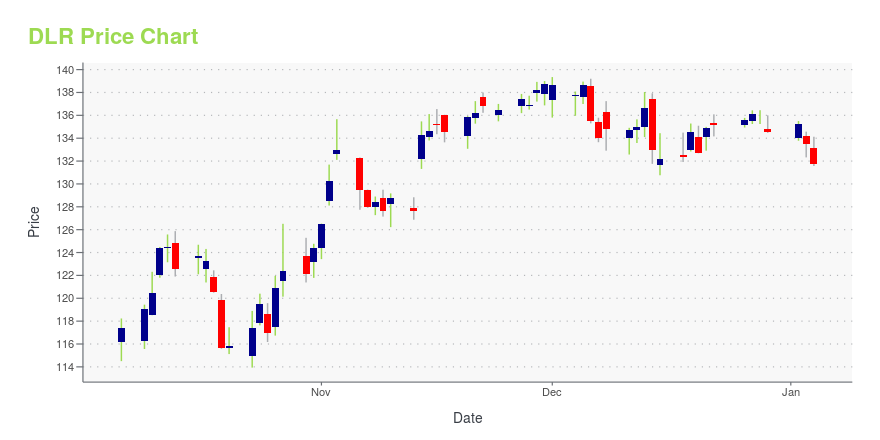
DLR Stock Price Chart Interactive Chart >
DLR Price/Volume Stats
Current price | $93.98 | 52-week high | $153.50 |
Prev. close | $92.40 | 52-week low | $85.76 |
Day low | $93.72 | Volume | 101,835 |
Day high | $94.33 | Avg. volume | 2,143,622 |
50-day MA | $105.96 | Dividend yield | 5.34% |
200-day MA | $111.44 | Market Cap | 27.38B |
Digital Realty Trust Inc. (DLR) Company Bio
Digital Realty Trust, Inc. is a real estate investment trust that invests in carrier-neutral data centers and provides colocation and peering services. As of December 31, 2019, the company owned interests in 225 operating data center facilities totaling 34.5 million rentable square feet in the United States, Europe, Asia, Canada, and Australia. The company's largest operating areas are: Northern Virginia, Dallas, Chicago, New York State, Silicon Valley, and London. (Source:Wikipedia)
Latest DLR News From Around the Web
Below are the latest news stories about DIGITAL REALTY TRUST INC that investors may wish to consider to help them evaluate DLR as an investment opportunity.
Down 45%, Is Digital Realty Trust a Smart Buy Right Now?Digital Realty Trust (NYSE: DLR) has been a target of a notable short-seller in recent months, but that's not the only reason the stock has dramatically underperformed the real estate sector. In this video, Fool. |
Digital Realty Trust (DLR) Outpaces Stock Market Gains: What You Should KnowIn the latest trading session, Digital Realty Trust (DLR) closed at $101.66, marking a +0.95% move from the previous day. |
3 Growth Stocks to Buy That Could Be Massive Long-Term WinnersIf you're looking for candidates for your long-term stock portfolio, consider growth stocks. Here are brief introductions to three growth stocks to consider. Semiconductor giant Nvidia (NASDAQ: NVDA) specializes in graphics processing units (GPUs) that are used by gaming systems, cloud computing operations, data centers, and others. |
3 Dividend Stocks That Could Skyrocket Over the Next 5 YearsMany investors would view dividend stocks as more similar to the tortoise than the hare. Here are three dividend stocks that could realistically skyrocket over the next five years. You might say that Digital Realty Trust (NYSE: DLR) has been like a hare running backward over the last 12 months. |
Digital Realty Trust (NYSE:DLR) shareholders have endured a 21% loss from investing in the stock a year agoPassive investing in an index fund is a good way to ensure your own returns roughly match the overall market. Active... |
DLR Price Returns
1-mo | -8.78% |
3-mo | -5.18% |
6-mo | -3.07% |
1-year | -31.98% |
3-year | -25.23% |
5-year | 6.45% |
YTD | -5.18% |
2022 | -41.00% |
2021 | 30.66% |
2020 | 20.37% |
2019 | 16.52% |
2018 | -3.00% |
DLR Dividends
Ex-Dividend Date | Type | Payout Amount | Change | ||||||
---|---|---|---|---|---|---|---|---|---|
Loading, please wait... |
Continue Researching DLR
Want to do more research on Digital Realty Trust Inc's stock and its price? Try the links below:Digital Realty Trust Inc (DLR) Stock Price | Nasdaq
Digital Realty Trust Inc (DLR) Stock Quote, History and News - Yahoo Finance
Digital Realty Trust Inc (DLR) Stock Price and Basic Information | MarketWatch
Loading social stream, please wait...