Deluxe Corporation (DLX): Price and Financial Metrics
DLX Price/Volume Stats
Current price | $20.57 | 52-week high | $21.97 |
Prev. close | $19.90 | 52-week low | $13.61 |
Day low | $20.16 | Volume | 191,300 |
Day high | $20.59 | Avg. volume | 219,437 |
50-day MA | $19.77 | Dividend yield | 5.87% |
200-day MA | $19.12 | Market Cap | 901.99M |
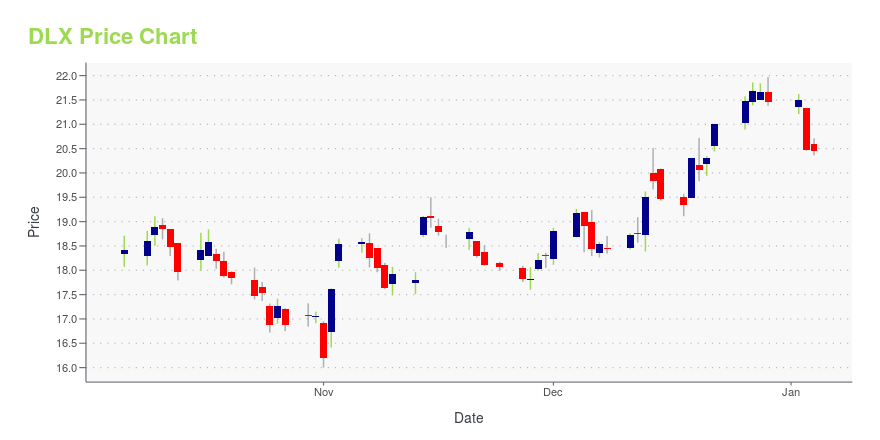
DLX Stock Price Chart Interactive Chart >
DLX POWR Grades
- DLX scores best on the Value dimension, with a Value rank ahead of 85.31% of US stocks.
- DLX's strongest trending metric is Quality; it's been moving up over the last 26 weeks.
- DLX's current lowest rank is in the Sentiment metric (where it is better than 33.53% of US stocks).
DLX Stock Summary
- The capital turnover (annual revenue relative to shareholder's equity) for DLX is 3.7 -- better than 85.85% of US stocks.
- DELUXE CORP's stock had its IPO on July 23, 1987, making it an older stock than 91.86% of US equities in our set.
- With a price/sales ratio of 0.4, DELUXE CORP has a higher such ratio than merely 13.13% of stocks in our set.
- Stocks that are quantitatively similar to DLX, based on their financial statements, market capitalization, and price volatility, are MATW, FLO, ESAB, IBP, and CRAI.
- Visit DLX's SEC page to see the company's official filings. To visit the company's web site, go to www.deluxe.com.
DLX Valuation Summary
- DLX's price/earnings ratio is 31.1; this is 74.72% higher than that of the median Communication Services stock.
- Over the past 243 months, DLX's price/earnings ratio has gone up 21.
Below are key valuation metrics over time for DLX.
Stock | Date | P/S | P/B | P/E | EV/EBIT |
---|---|---|---|---|---|
DLX | 2023-12-29 | 0.4 | 1.6 | 31.1 | 16.0 |
DLX | 2023-12-28 | 0.4 | 1.6 | 31.4 | 16.1 |
DLX | 2023-12-27 | 0.4 | 1.6 | 31.5 | 16.1 |
DLX | 2023-12-26 | 0.4 | 1.6 | 31.2 | 16.0 |
DLX | 2023-12-22 | 0.4 | 1.5 | 30.5 | 15.9 |
DLX | 2023-12-21 | 0.4 | 1.5 | 29.5 | 15.7 |
DLX Growth Metrics
- Its year over year cash and equivalents growth rate is now at -64.88%.
- The 3 year revenue growth rate now stands at 6.57%.
- Its 5 year price growth rate is now at -65.16%.
The table below shows DLX's growth in key financial areas (numbers in millions of US dollars).
Date | Revenue | Operating Cash Flow | Net Income to Common Stock |
---|---|---|---|
2022-12-31 | 2,238.01 | 191.531 | 65.395 |
2022-09-30 | 2,244.581 | 185.01 | 60.208 |
2022-06-30 | 2,221.684 | 199.197 | 57.947 |
2022-03-31 | 2,136.947 | 205.505 | 47.985 |
2021-12-31 | 2,022.197 | 210.821 | 62.633 |
2021-09-30 | 1,906.114 | 199.971 | 73.519 |
DLX's Quality Factors
The “Quality” component of the POWR Ratings focuses on 31 different factors of a companies fundamentals and operational strength. Here are some key insights as we drill into the specifics of these quality attributes.- DLX has a Quality Grade of C, ranking ahead of 65.54% of graded US stocks.
- DLX's asset turnover comes in at 0.825 -- ranking 5th of 14 Printing and Publishing stocks.
- JW.A, NYT, and NWSA are the stocks whose asset turnover ratios are most correlated with DLX.
The table below shows DLX's key quality metrics over time.
Period | Asset Turnover | Gross Margin | ROIC |
---|---|---|---|
2021-06-30 | 0.825 | 0.586 | 0.098 |
2021-03-31 | 0.891 | 0.595 | 0.109 |
2020-12-31 | 0.897 | 0.592 | 0.037 |
2020-09-30 | 0.923 | 0.599 | 0.058 |
2020-06-30 | 0.964 | 0.595 | -0.210 |
2020-03-31 | 0.975 | 0.592 | -0.195 |
DLX Price Target
For more insight on analysts targets of DLX, see our DLX price target page. And for a list of of all stocks sorted by upside potential based on analyst target price, see our Top Price Target page.
Average Price Target | $52.33 | Average Broker Recommendation | 1.5 (Moderate Buy) |
Deluxe Corporation (DLX) Company Bio
Deluxe Corporation provides a wide range of products and services including customized checks and forms, as well as website development and hosting, search engine marketing, search engine optimization, and logo design. The company was founded in 1915 and is based in Shoreview, Minnesota.
Latest DLX News From Around the Web
Below are the latest news stories about DELUXE CORP that investors may wish to consider to help them evaluate DLX as an investment opportunity.
Steelcase Inc. (SCS) Hit a 52 Week High, Can the Run Continue?Steelcase (SCS) is at a 52-week high, but can investors hope for more gains in the future? We take a look at the company's fundamentals for clues. |
4 Low Price-to-Book Stocks to Buy in the New YearThe P/B ratio helps to identify low-priced stocks with high growth prospects. Solo Brands (DTC), Park Hotels & Resorts (PK), Centene (CNC) and Deluxe Corporation (DLX) are some such stocks. |
The five-year loss for Deluxe (NYSE:DLX) shareholders likely driven by its shrinking earningsFor many, the main point of investing is to generate higher returns than the overall market. But every investor is... |
3 Exciting Small Cap Stocks with Dividend Yields Over 5%As broader markets continue to rally on the Fed's decision to leave rates unchanged, many small-cap stocks are joining the party. |
Buy These 5 Low Price-to-Book Value Stocks in DecemberThe P/B ratio helps to identify low-priced stocks that have high growth prospects. Solo Brands (DTC), Park Hotels & Resorts (PK), Flex (FLEX), Centene (CNC) and Deluxe Corp (DLX) are some such stocks. |
DLX Price Returns
1-mo | 6.09% |
3-mo | -4.10% |
6-mo | 10.66% |
1-year | 38.75% |
3-year | -41.99% |
5-year | -41.94% |
YTD | -4.10% |
2023 | 34.92% |
2022 | -44.40% |
2021 | 13.38% |
2020 | -38.90% |
2019 | 33.32% |
DLX Dividends
Ex-Dividend Date | Type | Payout Amount | Change | ||||||
---|---|---|---|---|---|---|---|---|---|
Loading, please wait... |
Continue Researching DLX
Here are a few links from around the web to help you further your research on Deluxe Corp's stock as an investment opportunity:Deluxe Corp (DLX) Stock Price | Nasdaq
Deluxe Corp (DLX) Stock Quote, History and News - Yahoo Finance
Deluxe Corp (DLX) Stock Price and Basic Information | MarketWatch
Loading social stream, please wait...