
DermTech, Inc. (DMTK): Price and Financial Metrics
DMTK Price/Volume Stats
| Current price | $0.09 | 52-week high | $3.90 |
| Prev. close | $0.11 | 52-week low | $0.09 |
| Day low | $0.09 | Volume | 3,662,300 |
| Day high | $0.10 | Avg. volume | 1,065,175 |
| 50-day MA | $0.44 | Dividend yield | N/A |
| 200-day MA | $1.08 | Market Cap | 3.29M |
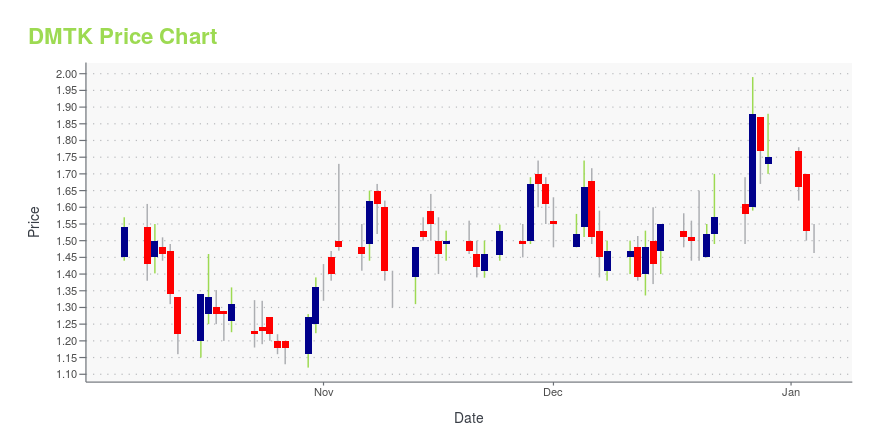
DMTK Stock Price Chart Interactive Chart >
DermTech, Inc. (DMTK) Company Bio
DermTech, Inc., a molecular diagnostic company, develops and markets novel non-invasive diagnostic tests to diagnosis skin cancer and related conditions in the United States. The company offers Pigmented Lesion Assay (PLA), a gene expression test that helps rule out melanoma and the need for a surgical biopsy of atypical pigmented lesions. It also provides Nevome test, an adjunctive reflex test for the PLA; and adhesive skin sample collection kits, as well as gene expression assays for the Th1, Th2, IFN-gamma, and Th17 inflammatory pathways. The company is also developing non-melanoma skin cancer diagnostic and non-melanoma skin cancer risk assessment products. The company sells its products primarily to pathology and oncology practitioners. DermTech, Inc. is headquartered in La Jolla, California.
Latest DMTK News From Around the Web
Below are the latest news stories about DERMTECH INC that investors may wish to consider to help them evaluate DMTK as an investment opportunity.
Today’s Biggest Pre-Market Stock Movers: 10 Top Gainers and Losers on FridayIt's time to dive into the biggest pre-market stock movers for Friday with all the shares investors will want to keep an eye on today! |
DermTech, Inc. (NASDAQ:DMTK) Q3 2023 Earnings Call TranscriptDermTech, Inc. (NASDAQ:DMTK) Q3 2023 Earnings Call Transcript November 2, 2023 DermTech, Inc. beats earnings expectations. Reported EPS is $-0.57, expectations were $-0.68. Operator: Ladies and gentlemen, thank you for standing by. Welcome to DermTech’s Third Quarter 2023 Financial Results Call. At this time, all participants are in a listen-only mode. After the speakers’ presentation, […] |
DermTech Inc (DMTK) Reports 10% Increase in Total Revenue for Q3 2023ASP for DermTech Melanoma Test Rises by 24% Year-Over-Year |
DermTech Reports Third-Quarter 2023 Financial ResultsSAN DIEGO, November 02, 2023--DermTech, Inc. (NASDAQ: DMTK) (DermTech or the Company), a leader in precision dermatology enabled by a non-invasive skin genomics technology, today reported its third-quarter 2023 financial results. |
DermTech Announces Release Date for Third-Quarter 2023 Financial ResultsSAN DIEGO, October 12, 2023--DermTech, Inc. (NASDAQ: DMTK) (DermTech or the Company), a leader in precision dermatology enabled by a non-invasive skin genomics technology, will host a conference call and webcast on Thursday, November 2, 2023 at 5:00 p.m. Eastern Time (ET) to discuss the Company's third-quarter 2023 operating and financial results. In advance of the call on November 2, 2023, DermTech will issue its third-quarter 2023 earnings press release. |
DMTK Price Returns
| 1-mo | -4.26% |
| 3-mo | -85.08% |
| 6-mo | -93.02% |
| 1-year | -96.91% |
| 3-year | -99.72% |
| 5-year | N/A |
| YTD | -94.86% |
| 2023 | -1.13% |
| 2022 | -88.80% |
| 2021 | -51.29% |
| 2020 | 161.61% |
| 2019 | -39.28% |
Loading social stream, please wait...